
Avances en Psicología Latinoamericana
ISSN:1794-4724 | eISSN:2145-4515
ISSN:1794-4724 | eISSN:2145-4515

Selective Attention and Error Proneness while Driving: Research Using a Conjunctive Visual Search Task
Atención selectiva y propensión al error en la conducción: estudio mediante una tarea de búsqueda visual conjunta
Atenção seletiva e propensão ao erro na condução: estudo mediante uma tarefa de busca visual conjunta
Silvana Andrea Montes, Isabel María Introzzi, Rubén Daniel Ledesma, Soledad Susana López
Selective Attention and Error Proneness while Driving: Research Using a Conjunctive Visual Search Task
Avances en Psicología Latinoamericana, vol. 34, no. 2, 2016
Universidad del Rosario
Isabel María Introzzi
Universidad Nacional de Mar del Plata, Argentina
Rubén Daniel Ledesma
Universidad Nacional de Mar del Plata, Argentina
Soledad Susana López
Universidad Nacional de Mar del Plata, Argentina
Received: June 24, 2014
Accepted: March 27, 2015
Abstract: Selective attention is a fundamental ability for safe driving. The objective of this work was to analyze the relationship between selective attention and a predisposition to experience inattention errors while driving. Thirty drivers from the City of Mar del Plata, Argentina, participated in the study and completed a selective attention task (Conjunctive Visual Search Task, CVST), and a driver inattention scale (Attention-related Driving Errors Scale, ARDES). Pearson correlations were calculated between the ARDES and the CVST performance measures (errors and reaction times). A consistent relationship was observed between CVST performance and the scores reported by the ARDES. Drivers with higher driver inattention proneness tended to commit a greater number of errors in target identification while also presenting lower reaction times. The results provide evidence of the possible role of selective attention in driver inattention, and illustrate the potential usefulness of a visual search measure in the area of driving assessment.
Keywords selective attention, driver inattention, evaluation, Conjunctive Visual Search, road safety.
Resumen: La atención selectiva es una habilidad fundamental para la conducción segura. El objetivo de este trabajo fue analizar la relación entre la atención selectiva y la propensión a cometer errores atencionales en el tránsito. Treinta conductores de la ciudad de Mar del Plata (Argentina) realizaron una tarea de atención selectiva (Tarea de Búsqueda Visual Conjunta [CVST]) junto con una escala que evalúa inatención en la conducción (ARDES). Se calcularon las correlaciones de Pearson entre el ARDES y las medidas de desempeño en CVST (errores y tiempos de reacción). Se observó una relación consistente entre el desempeño en la CVST y los puntajes del ARDES. Los conductores más propensos a la inatención en la conducción cometieron mayor cantidad de errores en la identificación del estímulo objetivo (target), a la vez que presentaron tiempos de reacción más bajos. Los resultados brindan evidencias sobre el posible rol de la atención selectiva en la inatención del conductor, y muestran la utilidad potencial de una medida de búsqueda visual conjunta en el ámbito de la evaluación de conductores.
Palabras clave: atención selectiva, inatención del conductor, evaluación, Búsqueda Visual Conjunta, seguridad vial.
Resumo: A atenção seletiva é uma habilidade fundamental para a condução segura. O objetivo deste trabalho foi analisar a relação entre a atenção seletiva e a propensão a cometer erros atencionais no trânsito. Trinta motoristas da cidade Mar del Plata (Argentina) realizaram uma tarefa de atenção seletiva (Tarefa de Busca Visual Conjunta, Conjunctive Visual Search Task [CVST] junto com uma escala que avalia inatenção na condução (Attention-related Driving Errors Scale [ARDES]. Calcularam-se as correlações Pearson entre p ARDES e as medidas de desempenho em CVST (erros e tempos de reação). Observou- se uma relação consistente entre o desempenho na CVST e as pontuações do ARDES. Os motoristas mais propensos à inatenção na condução cometeram maior quantidade de erros na identificação do estímulo objetivo (target), ao mesmo tempo que apresentaram tempos de reação mais baixos. Os resultados dão evidências sobre o possível papel da atenção seletiva na inatenção do motorista, e mostram a utilidade potencial de uma medida de busca visual conjunta no âmbito da avaliação de motoristas.
Palavras-chave: atenção seletiva, inatenção do motorista, avaliação, Busca Visual Conjunta, segurança vial.
Selective attention is a fundamental ability in the safe performance of the driving task. Drivers must be able to select relevant stimuli and ignore those stimuli that are irrelevant to the task (distractors). In fact, selective attention functions to regulate and control the interference caused by irrelevant stimuli (Diamond, 2013; Treisman & Sato, 1990). However, occasionally a driver’s attention focuses on matters not related to the driving task (e.g., talking on a cellphone, text messaging, conversing with a passenger, being lost in thought), generating “distractions” that can affect driving performance. This could result in degraded lane keeping, speed control, increased reaction time, missed traffic signals, shorter or longer following distances, unsafe gaps, reduced situational awareness, and poorer visual scanning (Regan & Hallett, 2011).
Driver distractions are a major road safety concern because they constitute an important risk factor in traffic collisions. Studies indicate that 80% of collisions and 65% of near crashes involve some form of driver inattention (Dingus et al., 2006; Klauer et al., 2006). Additionally, experts warn that these problems could increase as new technologies are introduced in vehicles (Blanco, Biever, Gallagher, & Dingus, 2006; Chan, Pradhan, Pollatsek, Knodler, & Fisher, 2010; Regan, Hallet, & Gordon, 2011). In summary, we believe there is an evident relationship between selective attention and driving inattention, and that the study of this process is therefore important to road safety; for example, in the search for tools to evaluate and train drivers.
One of the experimental paradigms most commonly used to evaluate selective attention is the conjunctive visual search paradigm derived from Feature Integration Theory (Treisman & Gelade, 1980). It is a brief and simple measure that demands the intense involvement of selective attention and the inhibitory function. This task is considered a valid and objective measure of selective attention. It has been used in fields as diverse as cognitive psychology, neuropsychology and clinical psychology (Booth et al., 2003; Muller & Krumennacher, 2006; Style, 2006; Tsal, Shalev, & Mevorach, 2005).
The Conjunctive Visual Search Task (CVST) also offers a useful paradigm for evaluation in the driving context, opening new lines of possible research. One basic application in this regard is the gathering of evidence that associates task performance with specific behaviors in the driving context. In fact, several studies have shown relationships between experimental measures of attention and propensity to distractions in various activities of daily life (Cheyne, Carriere & Smilek, 2006; Forster & Lavie, 2007; López-Ramón, Castro, Roca, Ledesma, & Lupiañez, 2011; Manly, Robertson, Galloway, & Hawkins, 1999; Robertson et al., 1997; Wallace & Vodanovich, 2003). The goal of this study was to analyze the relationship between CVST performance and the predisposition of drivers to experience attentional errors while driving. For this purpose, we analyzed if the CVST is associated with a specific measure of driver inattention: the Attention-related Driving Errors Scale (ARDES; Ledesma, Montes, Poó, & López-Ramón, 2010). The ARDES evaluates individual differences in the propensity to commit attentional failures while driving. Our working hypothesis is that drivers with a greater propensity for driver inattention (high ARDES scores) will tend to perform poorly on the CVST (e.g., greater errors in identifying the target stimulus). We hope to provide preliminary evidence of the CVST’s usefulness in the field of road safety.
Method
Participants
We worked with a convenience sample of n=30 drivers in the City of Mar del Plata, Argentina (between the ages of 19 and 69, Mean=38.17, S.D.=13.54, 53% male). The following inclusion criteria were used: must be of legal age, must have a driver’s license and must have driven regularly during the past month (at least once a week). The majority of subjects drove regularly (83.3% nearly every day; 16.6% some days of the week) and overall the sample had 18 years of driving experience on average. All participants had completed their high school education at the time of their participation and 60% had completed their university studies.
Measures
Selective attention was measured using the conjunctive visual search paradigm (Treisman & Gelade, 1980; Introzzi, Canet Juric, Comesaña, Andrés, & Richard´s, 2013). This is an experimental task that consists of finding a target defined by a combination of two visual characteristics: color and shape. The target is a blue square that may be present or absent among a variable set of distractor stimuli consisting of blue circles and red squares. Four display sizes are presented that vary in terms of the number of distractor stimuli: 4, 8, 16 and 32. In each block, half the distractors are red squares and the other half are blue circles. Each block has the same number of distractors distributed randomly. In half the tests, the target is present and in the other half it is absent. The stimuli are distributed randomly on a 7x6 matrix that is 9.5 cm wide by 8 cm tall. Participants are to respond as accurately and quickly as they can, pressing M on a keyboard with their right index finger if the target is absent and Z if the target is present. Each test is preceded by a white cross positioned in the center and displayed for 100 ms, after which the stimuli appear. Only after the subject has transmitted a response does the next test appear.
The task is comprised of an initial practice block of 10 tests and three evaluation (or experimental) blocks of 40 tests each. Each block contains 10 tests per display size. As previously mentioned, the target is present in half the test display sizes and absent in the other half. The different display sizes are randomly distributed in each block.
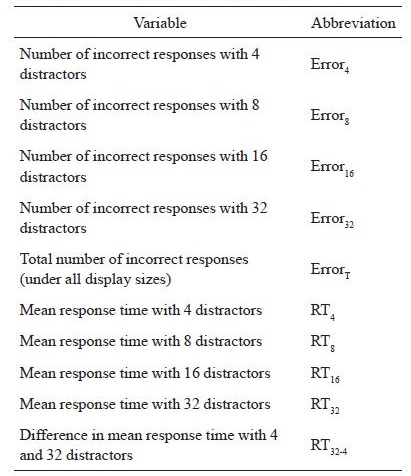
The performance variables and measures were: (1) Amount of errors: Consists of the total number of incorrect responses, differentiated by display sizes (4, 8, 16, and 32 distractors). The total amount of errors was calculated by adding the variables Error 4, 8, 16, and 32, and dividing by the number of display sizes. (2) Mean response time (RT): Consists of the mean response time differentiated by display sizes (4, 8, 16, and 32); mean RT in tests where the target is present and mean RT in tests where the target is absent. The three experimental blocks are structured identically: 10 tests for each display sizes, with the target present in half (5 tests) and absent in the other half. (3) Differences in RT between display sizes with 4 and 32 distractors: This variable, together with Total Error, was considered a ‘global’ variable for purposes of analysis. Table 1 summarizes the descriptions of the variables used.
Driver inattention proneness was measured using the ARDES (Ledesma et al., 2010), a self-reporting instrument comprised of 19 items that evaluate errors associated with attentional failures while driving (e.g., “At a street corner, I fail to realize that a pedestrian is crossing the street”). High scores on this scale reflect a high propensity to commit errors. The original study (Ledesma et al., 2010) provided preliminary evidence of the validity and reliability of its scores. The scale was shown to be a unidimensional measure with a high degree of internal homogeneity and consistency (Cronbach’s alpha=.88). It was also observed to have a strong correlation with other validation measures, including measures of attention-related errors in everyday life (Cheyne et al., 2006), present event awareness and attention (Brown & Ryan, 2003), dissociation (Bernstein & Putnam, 1986), and boredom proneness (Farmer & Sundberg, 1986). These findings indicate that ARDES reflects a trait-like propensity for driving inattention. ARDES also differentiated those who had reported traffic collisions and tickets for traffic violations from those who had not. Cronbach’s alpha for the present sample was .72.
Procedures
The task was administered using the computer program Cognitive Self-regulation Tasks (Tareas de Autorregulación Cognitiva [TAC], Introzzi et al., 2013). Half the subjects first responded to the ARDES scale and then the CVST; the order was inverted for the other half. When the instruments were administered, the experimental test generated results that were transmitted to a database that included the subject’s number, socio-descriptive data and the different performance variables. Subjects completed an informed consent form beforehand, wherein the nature and purpose of the research was explained to them, and they were guaranteed anonymity and confidentiality with respect to the administration of the instruments and the handling of their information.
Data analysis
First, an analysis was conducted to determine the internal coherence of CVST results; in other words, that the RTs were greater in display sizes where the target was absent and when there were a greater number of distractors. We used a Repeated Measures ANOVA to evaluate the effect on RT of the target’s presence and the number of distractors (4, 8, 16, and 32). Further, the relationship between reported driving errors and the experimental task was analyzed using Pearson correlations between the CVST’s performance measures (Errors and RT) and the ARDES scores. Partial correlation between the same variables was performed controlling for age. Finally, a multivariate analysis was applied to examine differences in task performance (Errors and RT) and in ARDES scores due to gender and age. Prior to the analysis, 2 cases were excluded due to excessively slow reaction times in the CVST (more than two SD from the mean RT).
Results
The CVST’s internal results were coherent with expectations. The repeated measures ANOVA indicated a significant effect on RT as a result of the presence of the Target (F(1) =44.725a, p<.01) and the number of distractors (F(3) =33.078a, p<.01). The interaction between both factors was also significant (F(3) =8.846a p<.01). As shown in Figure 1, RT slows as the number of distractors is increased.
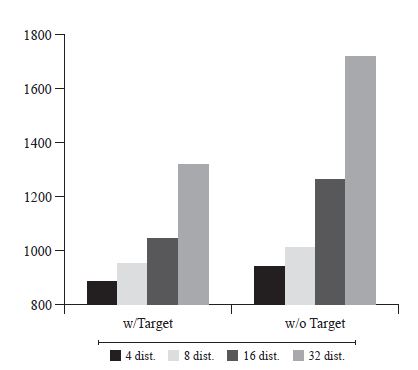
Table 2 shows Pearson correlations between CVST’s performance measures (Errors and RT) and the ARDES scores. With respect to the relationship between ARDES scores and CVST performance, a positive correlation was observed with the number of total errors (ErrorT) committed in the task (r=.41, p<.05). No significant correlations were observed when differentiated by display sizes (Error4, Error8, Error16 and Error32). With respect to RT, the ARDES correlated negatively with the variables RT32-4 (r= –.44, p<.01), RT16 (r= –.37, p<.05), and RT32 (r= –.41, p<.05). No significant correlations were observed between the ARDES and the variables RT4 (r= –.17, p>.05) and RT8 (r= –.25, p>.05). It should be noted that although the correlations between the ARDES and the RTs were significant in display sizes with 16 and 32 distractors, these tended to increase with the number of distractors. Additionally, correlations between the Error (Error4, Error8, Error16 and Error32 and ErrorT) and RT (RT4, RT8, RT16, RT32, and RT32-4) variables were not found to be statistically significant.
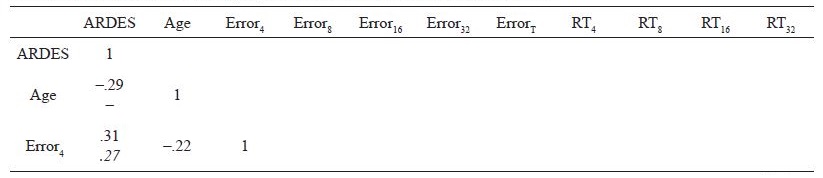
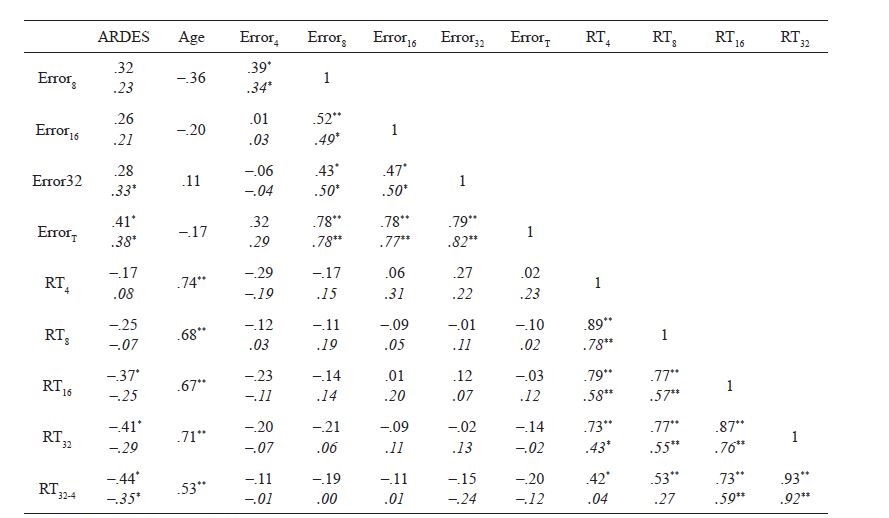
Regarding age, positive and strong correlations with RT were found in the different display sizes (RT4, RT8, RT16, RT32, and RT32-4), but not with the amount of errors in the task. No correlation with ARDES scores was observed.
When controlling for age, correlations between CVST and ARDES remain, although they tend to decrease slightly. RT16 and RT32 are no longer significant. Multivariate analysis showed significant effect of age on RT variables, RT4 (F (1)=31.44, p<.01), RT8 (F (1)=22.46, p<.01), RT16 (F (1)=21.84, p<.01), RT32 (F (1)=26.05, p<.01), and RT32-4 (F (1)=4.14, p<.05), but not on Error variables, Error4 (F (1)=1.28, p> .05), Error8 (F (1)=3.76, p> .05), Error16 (F (1)=1.05, p> .05), Error32 (F (1)=.29, p> .05), y RTT (F (1)=.79, p> .05). .Finally, no significant differences in the task performance, nor in ARDES scores resulted from gender, Error T (F (1)=.52, p>.05), RT32-4 (F (1)=2.01, p>.05), ARDES (F (1)=1.59, p>.05).
Discussion
This study sought to provide preliminary evidence of the relationship between driver inattention and selective attention, and of the possible usefulness of a visual search task as an assessment tool. Although a great deal more research is needed, the results of this study are promising. In general, we observed that CVST performance is associated to a driver inattention measure, which suggests that it could be useful in the field of road safety.
Drivers with the highest propensity for driver inattention performed worse in the attentional task, as shown by a greater number of target identification errors (interpreted as attentional lapses). A result that is more difficult to interpret is the inverse relationship between ARDES scores and RT in the CVST. One possibility is that the inattention tendency measured by ARDES may reflect failures in inhibitory control, resulting in hurried responses. We believe future research is needed to test this hypothesis. The CVST indicators that differentiated the most were, first, the difference in the response times in display sizes with 32 and 4 distractors (RT32-4), which is one of the better measures of selective attention failures because it reflects a decrease in performance as the number of distractors increases (Tsal et al., 2005). Therefore, the higher the value of this variable, the less efficient one’s selective attention.
The second indicator, the response time in display sizes with 32 distractors (RT32), is more ‘demanding’ because the higher number of distractors requires the greatest exercise of selective attention. And the third, ‘Total Errors,’ refers to the number of incorrect responses or errors in all display sizes. Additionally, it should be noted that no significant relationship was observed with these indicators in display sizes with 4 and 8 distractors (RT4, RT8, Error4, Error8), which was to be expected because selective attention is practically not engaged with such low numbers of distractor stimuli.
On the other hand, the impact of age over CVST’s reaction times is in line with the great deal of evidence indicating that advancing age is accompanied by a decline in performance on a wide variety of cognitive tasks, both in the laboratory and in everyday life (see for example Van der Linden, & Collette, 2002). At first glance, this result could suggest an impairment on driving performance, however, one must be cautious in predicting performance of older drivers from cognitive abilities. In fact, there is evidence that many older drivers compensate age-related declines while driving (e.g., reducing their speed, avoiding difficult driving conditions) (Andrews & Westerman, 2012; Ball et al., 1998; Hakamies-Blomqvist & Wahlström, 1998). Indeed, previous evidence showed that novice drivers are at a greater risk of crashing (see for example Chan et al., 2010).
From a substantive perspective, the results indicate a relationship between driver inattention and the efficiency of selective attention. This is coherent with previous studies that suggest that driver inattention is not only a situational phenomenon or one specific to driving, but also one that is explained by personal variables pertaining to the driver (e.g., general error propensity, dissociative traits, boredom proneness) (Ledesma et al., 2010). To achieve a more global vision of the factors underlying attention-related errors, it would be necessary to evaluate the interaction between these cognitive variables and personality, together with other contextual variables.
In summary, the results provide initial evidence that the CVST may be a valid measure to use in the driving context for research purposes, evaluation and prevention. Further research is needed to broaden the evidence of validity for the CVST in the driving context, using more representative samples and data on attentional driving errors from other information sources (e.g., naturalistic observation, simulated driving tasks, accident data).
References
Andrews, E.C., & Westerman, S. J. (2012). Age differences in simulated driving performance: Compensatory processes. Accident Analysis and Prevention, 45, 660-668.
Ball, K., Owsley, C., Stalvey, B., Roenker, D.L., Sloane, M. E., & Graves, M. (1998). Driving avoidance and functional impairment in older drivers. Accident Analysis and Prevention, 30, 323-330.
Bernstein, E.M., & Putnam, F.W. (1986). Development, reliability, and validity of a dissociation scale. Journal of Nervous and Mental Disease, 174, 727-735.
Blanco, M., Biever, W.J., Gallagher, J.P., & Dingus, T.A. (2006). The impact of secondary task cognitive processing demand on driving performance. Accident Analysis and Prevention, 38, 895-906.
Booth, J.R., Burmann D.D., Meyer, J.R.; Lei, Z., Trommer, B.L, Davenport, N.D., Li, W., et al. (2003). Neural development of selective attention and response inhibition. NeuroImage, 20(2), 737-751.
Brown, K.W., & Ryan, R.M. (2003). The benefits of being present: Mindfulness and its role in psychological well-being. Journal of Personality and Social Psychology, 84, 822-848.
Chan, E., Pradhan, A.K., Pollatsek, A., Knodler, M.A., & Fisher, D.L. (2010). Are driving simulators effective tools for evaluating novice drivers’ hazard anticipation, speed management, and attention maintenance skills? Transportation Research Part F: Traffic Psychology and Behaviour, 13, 343-353.
Cheyne, J.A. Carriere, J.S.A., & Smilek, D. (2006). Absent-mindedness: Lapses of conscious awareness and everyday cognitive failures. Consciousness and Cognition, 15, 578-592.
Diamond, A. (2013). Executive functions. Annual Review of Psychology, 64, 135-168.
Dingus, T.A., Klauer, S.G., Neale, V.L., Petersen, A., Lee, S.E., Sudweeks, J., Perez, M.A., Hankey, J., Ramsey, D., Gupta, S., Bucher, C., Doerzaph, Z.R., Jermeland, J., & Knipling, R.R. (2006). The 100-Car Naturalistic Driving Study, Phase II—Results of the 100-car field experiment. Technical Report No. DOT HS 810 593. Washington, DC.: National Highway Traffic Safety Administration.
Farmer, R. & Sundberg, N.D. (1986). Boredom Proneness: The development and correlates of a new scale. Journal of Personality Assessment, 50, 4-17.
Forster, S. & Lavie, N. (2007). High perceptual load makes everybody equal: Eliminating individual differences in distractibility with load. Psychological Science, 18, 377-382.
Hakamies-Blomqvist, L., & Wahlström, B. (1998). Why do old drivers give up driving? Accident Analysis and Prevention, 30, 305-312.
Introzzi, I.M., Canet Juric, L., Comesaña, A., Andrés, M. L., & Richard´s, M.M. (2013). Evaluación de la autorregulación cognitiva y emocional: Presentación de un programa. Proceedings of Simposio. Resúmenes de la XIV Reunión Nac. y III Enc. Internacional de la AACC. Revista Argentina de Ciencias del Comportamiento, Suplemento (Julio), 384-461.
Klauer, S.G., Dingus, T.A., Neale, V.L., Sudweeks, J.D., & Ramsey, D.J. (2006). The impact of driver inattention on near-crash/crash risk: An analysis using the 100-car naturalistic driving study data. DOT HS 810 594. Washington, DC: National Highway Traffic Safety Administration. Retrieved from: http://www.nsc.org/safety_road/Distracted_Driving/Documents/The%20Impact%20of%20Driver%20Inattention%20on%20Near-Crash.pdf
Ledesma, R., Montes, S., Poó, F. & López-Ramón, M.F (2010). Individual differences in driver inattention: The Attention-related Driving Errors scale. Traffic Injury Prevention, 11, 142-150.
López-Ramón, M.F., Castro, C., Roca, J., Ledesma, R., & Lupiañez, J. (2011). Attentional networks functioning, age, and attentional lapses while driving. Traffic Injury Prevention, 12, 518-528.
Manly, T., Robertson, I.H., Galloway, M., & Hawkins, K. (1999). The absent mind: Further investigations of sustained attention to response. Neuropsychologia, 37, 661-670.
Muller, H.J. & Krummenacher, J. (2006). Visual search and selective attention. Visual Cognition, 14, 389-410.
Regan, M. & Hallet, C. (2011). Driver distraction. In B. Porter (Ed.), Handbook of traffic psychology (pp. 275-286). San Diego, USA: Academic Press.
Regan, M., Hallett, C., & Gordon, C. (2011). Driver distraction and driver inattention: Definition, relationship and taxonomy. Accident Analysis & Prevention, 43, 1771-1781.
Robertson, I. H., Manly, T., Andrade, J., Baddeley, B. T., & Yiend, J. (1997). ‘Oops!’: Performance correlates of everyday attentional failures in traumatic brain injured and normal subjects. Neuropsychologia, 35, 747-758.
Styles, E. A. (2006). The psychology of attention (2nd ed.). London: Psychology Press.
Treisman, A.M. & Gelade, G. (1980). A feature-integration theory of attention. Cognitive Psychology, 12, 97-136.
Treisman, A.M. & Sato, S. (1990). Conjunction search revisited. Journal of Experimental Psychology Human Perception and Performance, 16, 451-478.
Tsal, Y., Shalev, L. & Mevorach, C. (2005). The diversity of attention deficits in ADHD: The prevalence of four cognitive factors in ADHD versus Controls. Journal of Learning Disabilities, 38, 142-157.
Van der Linden, M. & Collette, F. (2002). Attention and normal ageing. In M. Leclercq & P. Zimmermann (Eds.), Applied Neuropsychology of Attention: Theory, Diagnosis and Rehabilitation (pp. 205-229). New York: Psychology Press.
Wallace, J. C. & Vodanovich, S. J. (2003). Can accidents and industrial mishaps be predicted?: Further investigation into the relationship between cognitive failure and reports of accidents. Journal of Business and Psychology, 17, 503-514.
Author notes
Universidad Nacional de Mar del Plata, Matheu 212. 3° ‘B’, Mar del Plata (7600), Argentina. E-mail: silvanamontes3@gmail.com
Additional information
How
to cite this article: Montes, S.A., Introzzi, I.M., Ledesma, R.D., López, S.S.
(2016). Selective Attention and Error Proneness while Driving: Research Using a
Conjunctive Visual Search Task. Avances
en Psicología Latinoamericana,
34(2), 195-203. doi: http://doi.org/10.12804/apl34.2.2016.01


