
Forecasting Formal Employment in Cities
Pronósticos de empleo formal urbano
Previsões para o emprego formal urbano
Forecasting Formal Employment in Cities
Revista de Economía del Rosario, vol. 24, no. 1, 2021
Universidad del Rosario
Received: 13 september 2020
Accepted: 04 november 2020
Additional information
To quote this article: Lora, E. (2021). Forecasting Formal Employment in Cities. Revista de Economía del Rosario, 24(1), 1-38. https://doi.org/10.12804/revistas.urosario.edu.co/economia/a.10029
Abstract:
Can “full and productive employment for all” be achieved by 2030 as per un Development Goal 8? The issue was assessed for 62 Colombian cities using administrative data. Larger cities have higher formal occupation rates because formal employment creation is restricted by the availability of the skills needed in complex sectors, which follows a path-dependent process. Alternative forecasts were produced using ols and machine learning algorithms. Results: the share of the working population in formal employment will increase between 13 and 32 percentage points, which is insufficient to achieve the goal. Consistency across methods was good for large cities, not for small ones.
Classification JEL: J21.
Keywords: Employment, cities, skills, forecasts, sustainable development, Colombia.
Resumen:
¿Se puede lograr el “empleo pleno y productivo para todos” en el 2030, según el Objetivo de Desarrollo 8 de la onu? El asunto se evaluó para 62 ciudades colombianas, utilizando datos administrativos. Las ciudades más grandes tienen tasas de ocupación formal más altas porque la creación de empleo formal está restringida a la disponibilidad de las habilidades necesarias en sectores complejos, un proceso dependiente de la trayectoria. Se hicieron pronósticos alternativos utilizando ols y algoritmos de aprendizaje automático. Resultados: el porcentaje de la población en edad de trabajar con un empleo formal aumentará entre 13 y 32 puntos porcentuales, lo que es insuficiente para alcanzar la meta. La coherencia entre los métodos es buena para las grandes ciudades, no para las pequeñas.
Clasificación JEL: J21.
Palabras clave: empleo, ciudades, habilidades, pronósticos, desarrollo sostenible, Colombia.
Resumo:
Um “emprego pleno e produtivo para todos” pode ser alcançado até 2030 de acordo com o Objetivo de Desenvolvimento 8 das Nações Unidas? O assunto é avaliado em 62 cidades colombianas com base em dados administrativos. As cidades maiores têm taxas de emprego formal mais altas porque a criação de empregos formais é restringida pela disponibilidade das habilidades necessárias em setores complexos, um processo dependente da trajetória. São realizadas previsões alternativas usando ols e algoritmos de aprendizado automático. Resultados: o percentual da população em idade ativa com emprego formal aumentará entre 13 e 32 pontos percentuais, o que é insuficiente para atingir a meta. Coerência entre métodos: bom para cidades grandes, não para cidades pequenas.
Classificação JEL: J21.
Palavras-chave: emprego, cidades, habilidades, previsões, desenvolvimento sustentável, Colômbia.
Introduction
United Nations Sustainable Development Goal 8 is to “Promote sustained, inclusive and sustainable economic growth, full and productive employment and decent work for all”. More specifically, target 8.3 seeks to “[b]y 2030, achieve full and productive employment and decent work for all women and men, including for young people and persons with disabilities, and equal pay for work of equal value”. This paper assesses how achievable this target is for Colombia, based on a novel theory of formal employment creation in cities and two complementary forecasting methods: standard regressions and machine learning.
Cities are necessary for economic growth to take place through a process of diversification and innovation that leads to productive employment and decent work for larger shares of the population. However, urbanization is not a sufficient condition for industrialization and productive employment: the expected relation between urbanization, industrialization, and employment quality is absent in many parts of the world (Gollin et al., 2016). Urbanization patterns, not just urbanization rates or macroeconomic factors (such as natural resource abundance), may shed light on the role of cities in economic growth and formal employment creation as suggested by two reliable facts (O’Clery et al., 2020): (i) formal occupation rates are more variable across cities within countries than across developing countries and (ii) larger cities create proportionally more formal employment.
Theoretical Framework
One of the central issues in economic development theory is the reason for the size and persistence of informal labor in developing economies. Since formal firms have access to capital and technology that make them more productive than small or family businesses, what explains the large quantity of labor force not occupied in the formal sector where labor conditions are better than in the informal sector? Economic theory has provided several explanations. In dualistic models of informality, the self-employed and their family businesses are fundamentally different from formal firms in the type of human capital they use —mainly uneducated and unproductive entrepreneurs and managers—, and in what they produce —mainly low-quality products for low-income customers—. The formal and informal sectors coexist because they are different (Lewis, 1954; Harris & Todaro, 1970; Rauch, 1991). An alternative view is that of De Soto (1989, 2000), who considers that informal firms are an untapped reservoir of productive resources held back by government regulations. Relatedly, Levy (2008) sees informal businesses as entrenched firms that survive despite their low productivity by avoiding taxes and regulations. Lastly, in labor search models, which take into account the costs and benefits of labor regulations, informal employment is not the consequence of exclusion, but the result of labor market frictions between heterogeneous workers and firms (Albrecht et al., 2009; Bosch & Maloney, 2010; Ulyssea, 2010; Meghir et al., 2015).
While empirical evidence has been provided to support each of these explanations of informality, none of them recognizes the two facts mentioned in the introduction: that formal occupation rates across cities (within a given country) have a larger variance than across countries and that formal occupation rates are directly and significantly associated with city size. In other words, none of the mainstream theories can explain the role of cities in formal employment creation. Furthermore, some of the main variables put forward by those theories to explain the presence of informality —such as social security regimes and labor hiring and firing legislation— have little or no variance across cities within each country.
In view of these shortcomings, this paper adopts the theoretical framework developed by O’Clery et al. (2019, 2020), which differs from previous theories in a number of ways. First, it focuses on cities rather than countries because cities are the actual locations where workers and their employers interact. Second, it emphasizes skill diversity —which is central in urban economics— rather than skill levels, educational attainment, or managerial capabilities. Third, it assumes that firms evolve by tinkering with skills because many feasible technologies cannot be known in advance but need to be discovered. Formal employment creation in cities results from this evolutionary process. In larger cities, firms have better access to the diverse skills they need to produce more sophisticated goods.
Accordingly, in O’Clery et al. (2019), the creation of formal employment between period t and period t+n in city c, ∆empC depends on “complexity potential” cp in period t, which is a measure of the availability of skills of the local labor force needed in the more complex industries not yet present in the city:
 (1)
(1)
 (2)
(2)Notice that complexity potential is a weighted average of the industry complexityCi of the missing sectors at time t Mc, t, with weights given by the densityd, i of industries that use skills similar to those of the missing sectors.
In order to operationalize equation (2), data are needed on industry complexity, missing sectors, and skill similarity between all pairs of industries. Since skills are tacit knowledge and therefore unobservable, industry complexity and complexity potential must be computed indirectly. To that end, O’Clery et al. (2019) make use of the methodologies developed by Hidalgo and Hausmann (2009) and Neffke and Henning (2013). In essence, industry complexity is a measure of the range of skills needed in an industry, which is obtained from the number of industries present in the cities that have the industry (i.e., those industries that have revealed a comparative advantage greater than 1 in a city, based on formal employment shares) and the number of cities that have the industry (i.e., those cities where the industry has revealed a comparative advantage greater than 1). Skill similarity between a pair of industries is measured by the relative intensity of the labor flows between the two industries, and missing industries in a city are those with a revealed comparative advantage lower than 1.
Data and Empirical Definitions
Like in O’Clery et al. (2019, 2020), I use data for Colombian cities larger than 50.000 inhabitants. My definition of cities rests on the methodology proposed by Duranton (2015) to define metropolitan areas. It consists of adding iteratively a municipality to a metropolitan area if there is a share of workers above a given threshold that commute from the municipality to the metropolitan area. Assuming a 10 % threshold, the methodology generates 19 metropolitan areas that consist of two or more municipalities (comprising a total of 115 municipalities). Since another 43 individual municipalities have populations above 50.000 inhabitants, a total of 62 cities was obtained.
The main data source for the 62 cities was the social security administrative data collected by the Ministerio de Salud y Seguridad Social (Health and Social Security Ministry), known as pila (Planilla Integrada de Liquidación de Aportes). pila contains information of workers and firms on the days worked, the sector of activity, and the municipality.1 To aggregate these data, I count the share of the year t that each worker effectively contributed to the social security system through firms per city c per industry j (empc,j). This is the formal employment for a given sector (or for the aggregate of all sectors within a city). Sectors are defined at the 4-digit industry level of the International Standard Industrial Classification (isic, revision 3.0).
The formal employment rate in city c in year t (fc, t) is defined as formal employment divided by the city-wide population 15 years old or older (popc, t, estimated by dane):
 (3)
(3)The (simple) average formal occupation rate in cities was only 20.3 % of the working age population in 2015 with a relatively large standard deviation (11.1 %). Important changes in urban formal occupation rates occurred between 2008 and 2015: the aggregate formal occupation rate for the 62 cities went up from 21.1 to 31.2 % with a (simple) average increase across cities of 8.1 % and a standard deviation of 5.4 %. Formal occupation was facilitated by a rate of gdp growth of 4.1 % and probably by the elimination in May of 2013 of payroll taxes and surcharges representing up to 13.5 % of the wage bill of some groups of workers (Kugler et al., 2017).
Since the formal employment rate is a variable bounded between 0 and 1, and the aim is to assess how fast it approaches 1, it is transformed to its logistic form, time-differentiated and expressed in annual terms:
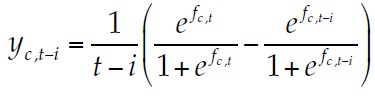 (4)
(4)Where yc, t – i will be the dependent variable and the subscript i is the year-interval or number of years for the time-differentiation (which may take values between 1 and 7, given that the data cover an 8-year span). For intuition’s sake, I will refer to the dependent variable as the annual speed towards full employment, or speed, for short.
The independent variables (at time t-i) were complexity potential, CPc, t – i, as explained above, the (log of) working age population, lpopc, t – i, the logistic of formal occupation rate, 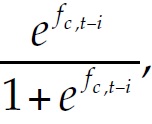 a dummy for the oil-producing cities (those with more than one oil well per 10.000 inhabitants: Acacías, Arauca, Barrancabermeja, Neiva, and Yopal), and a synthetic measure of the exogenous sectoral shocks by city c (following McGuire and Bartik 1991, the so-called Bartik shock measure for city c at time t is a weighted average of the rates of change between t-i and t of formal employment by sector at the national level, excluding city c, with weights equal to the employment share of each sector in city c in year t-i).2
Two forecasting methods were used in a complementary way. As I will explain, the two methods look at the issue from different angles, the first being better grounded in theory but quite limited in the choice of specifications, and the second being more flexible operationally but theoretically ad hoc. The first method was based on ordinary least square regressions for all the possible time frequencies of the yearly data between 2008 and 2015. After discussing the lack of consistency of some of the coefficients, two regressions were chosen to forecast the dependent variable by city and compute the formality rates by city in 2030. The second method, further explained in section 5, was a machine learning technique known as “random forest” by which a set of alternative results are predicted based on combinations of explanatory variables presumedly associated with the results (in an unknown non-linear fashion). The two methods are complementary because, while ols provides light on the possible influence of each individual variable, its predictions can only be reliable if the coefficients can be consistently estimated and the relation between the dependent and independent variables (or combinations thereof) is known in advance. These limitations do not apply to machine learning techniques, which are intended to produce reliable predictions using probabilistic methods that make efficient use of all the data that may be relevant. While the machine learning method is agnostic from a theoretical point of view and does not produce unbiased estimates of the coefficients that relate the dependent and the independent variables, it provides more nuanced forecasts at the city level, as I will discuss further below.
Regression-Based Forecasts
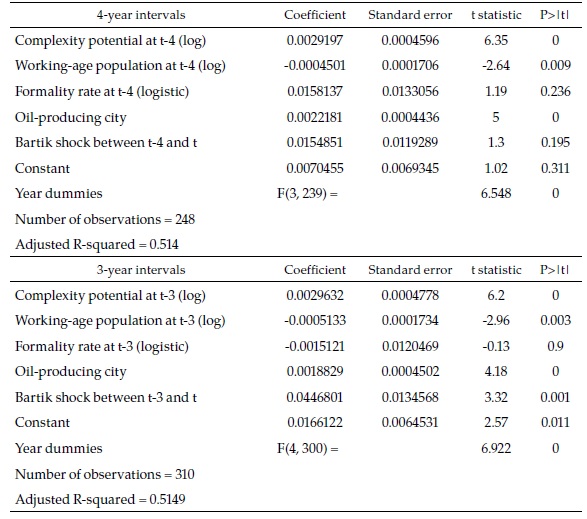
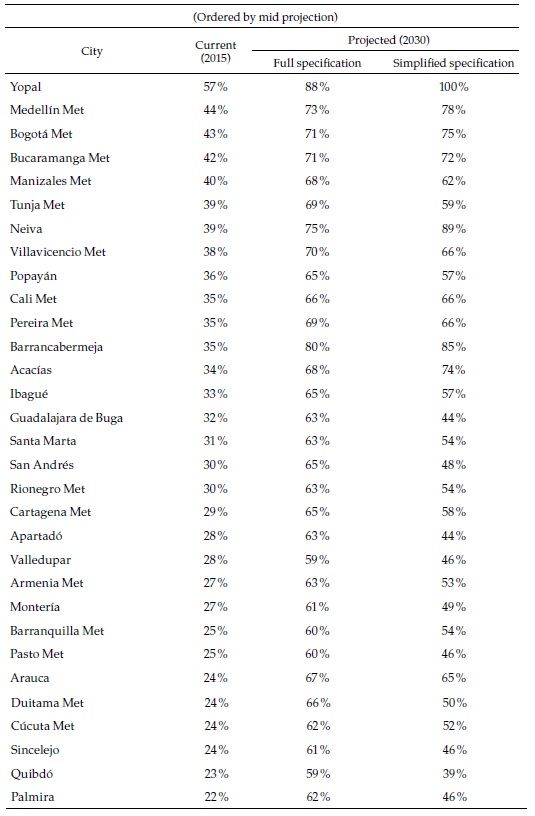
Table 1 is a summary of the regressions. Only the 7-year (i.e., full 2008-2015) and 1-year interval regressions are presented (see Appendix 1 for all the intervals). In the upper panel, the 62 observations correspond to the number of cities because there is only one period. In the two other panels, the number of observations is 434 since there are seven one-year periods (434=62 x 7).
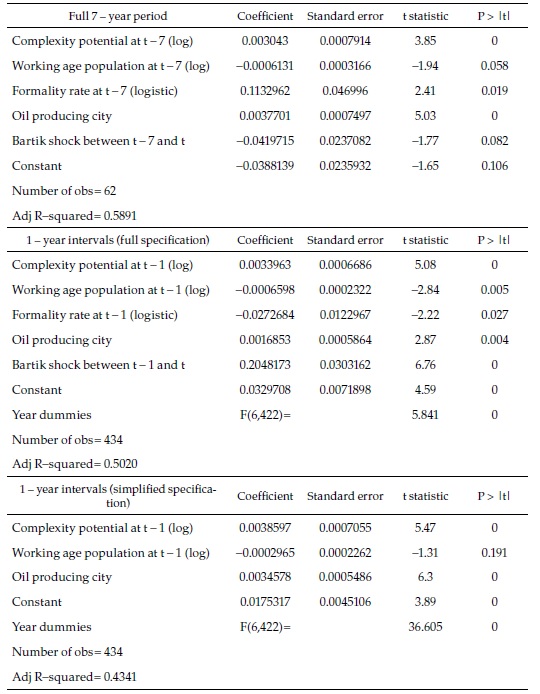
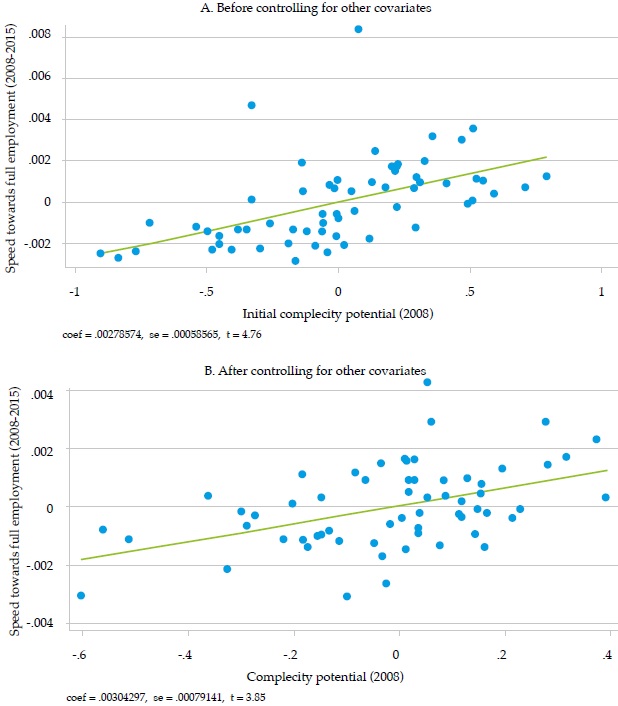
Before explaining the results in detail, it is important to highlight that the main explanatory variable in all the regressions is the initial complexity potential: our measure of the initial availability in the city of the diversity of skills needed in the industries more complex than the industries already present in the city. Figure 1 shows (for the full period 2008-2015) the remarkable relationship between this variable and the speed towards full employment, the dependent variable. The left side panel shows the relation without any controls (apart from a constant term), and the right one shows the relation after controlling for the other explanatory variables, based on the regression of the upper panel.
The interpretation of the coefficients in Table 1 is not straightforward because of the way the dependent variable is defined. However, it is clear that, although all the explanatory variables are significantly associated with the speed towards full employment, some change sign between the 7-year and the 1-year full specification (upper and middle panels). This suggests that their relationship with the dependent variable is not fully captured: there may be important interactions between the explanatory variables or dynamic issues that are ignored in the specification adopted. Since the number of cities, as well as the number of periods is small, not much can be done to overcome these problems with standard econometrics.
The lower panel shows a simplified version of the 1-year interval regression, which only includes three explanatory variables. While complexity potential and the dummy variable for oil-producing cities are significantly and consistently directly or inversely associated with the dependent variable in other regressions, the working-age population is not. However, it is included because it is the variable that motivates the theoretical model summarized in a previous section.
I use the coefficients of the middle and lower panel regressions to forecast formal employment in 2030 with the following additional assumptions:
The complexity potential by city is assumed constant at the 2015 values.
The working-age population by city is projected at the same growth rate observed between 2008 and 2015.
The oil producing city dummy is kept unchanged throughout the forecast period.
In order to compute formal employment at the end of the forecast period, the formality rate at t-1 (logistic) by city must be calculated recursively with the dependent variable’s forecast for the previous year. This procedure has no bearing in the results.
Basing a 15-year forecast (i.e., 2015 to 2030) on eight years of observations is dictated by the availability of data and the purpose of the exercise. However, neither on theoretical nor on empirical grounds is the exercise far-fetched. The theory rests on the assumption that formal creation is an evolutionary process, which, as such, is reinforced rather than weakened through time. This is corroborated empirically by the fact that the 7-year specification (in the high panel above) has a similar explanatory power than the comparable 1-year specification (middle panel), in spite of the fact that the latter include time dummies. Furthermore, the coefficient of complexity potential (the key variable in the theoretical model) is highly significant and practically identical in both regressions.
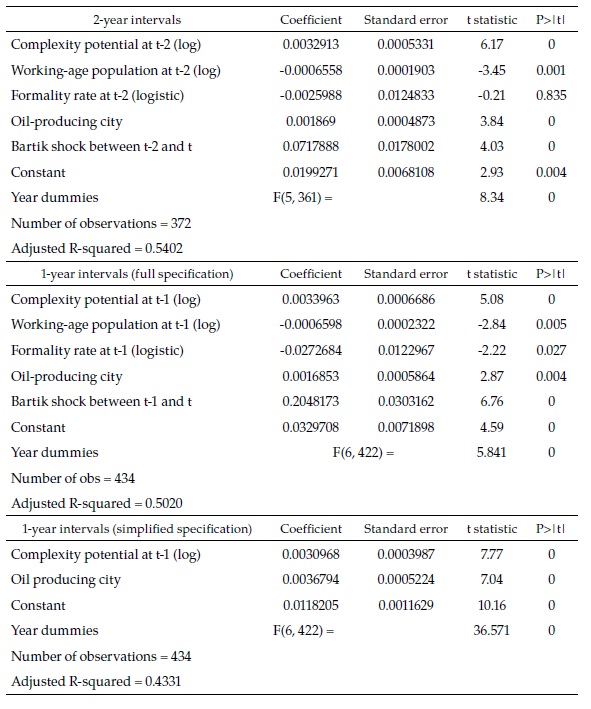
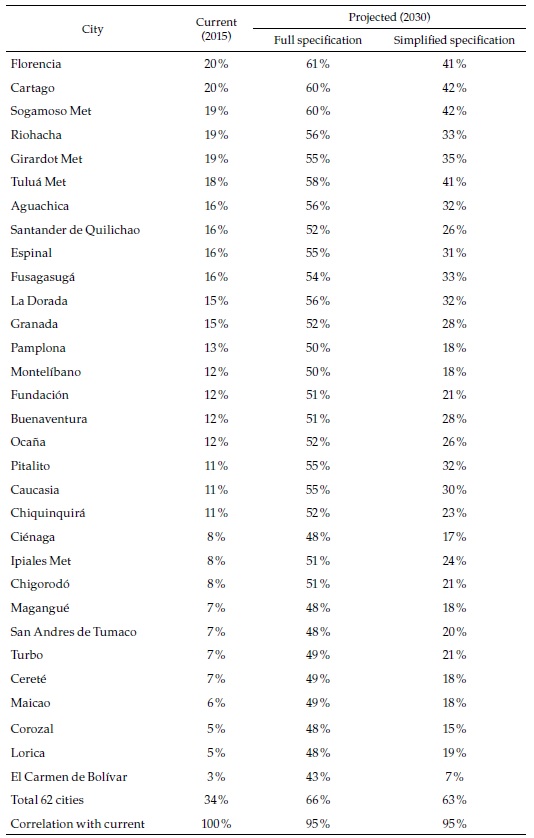
The results appear in Figures 2-4 (and Appendices 1 and 2). Figure 2 shows that formality rates will increase throughout the whole sample of cities and forecast options: all cities will advance towards the full-formal employment target. However, it is unclear whether formality rates will tend to converge. In the full specification, formality rates tend to converge because all increase by about the same, but in the simplified specification, they tend to diverge —increases are proportional to the initial values—. Also, with the full specification, formal employment rates in many cities will be above 0.6 and even 0.8 in 2030, suggesting that “full and productive employment and decent work for all women and men” may be within reach. But in the simplified specification, only a handful of cities will get that high.
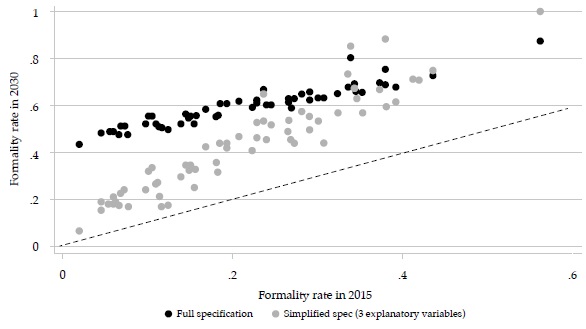
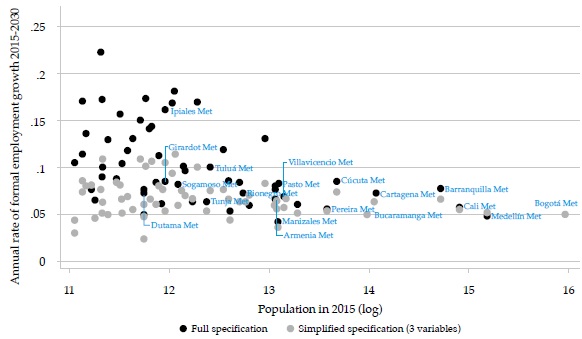
Figure 3 makes clear that the differences between the two forecasts are strongly related to city size (although this variable is included in both regressions, it is not significant in the second one and its effect on the forecasts is extremely small): while for the smaller cities the rates of employment growth can differ by more than 10 %, for the largest cities, the differences are negligible (the figure shows only the names of the multi-municipality cities, most of which are also the largest ones).
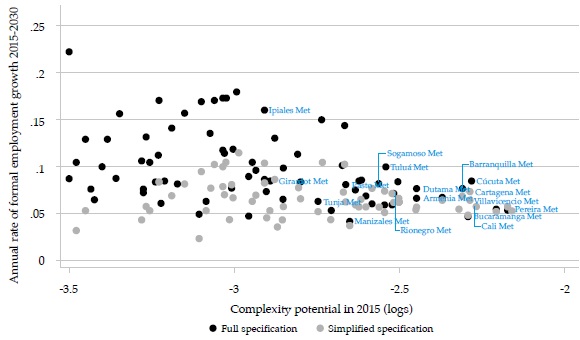
Although the theoretical framework emphasizes the importance of complexity potential (and Figure 1 above corroborates it), it may not be the unique factor influencing the forecasts, as suggested by Figure 2, with the full specification, that includes other variables, many of the low-complexity cities show high formal employment rates, which is not apparent in the simplified specification. In the latter, the fastest-growing cities have medium levels of initial complexity potential.
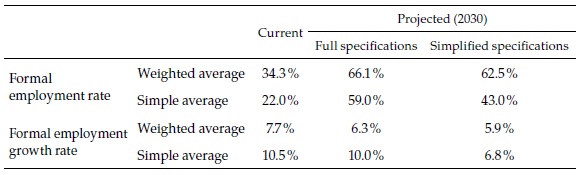
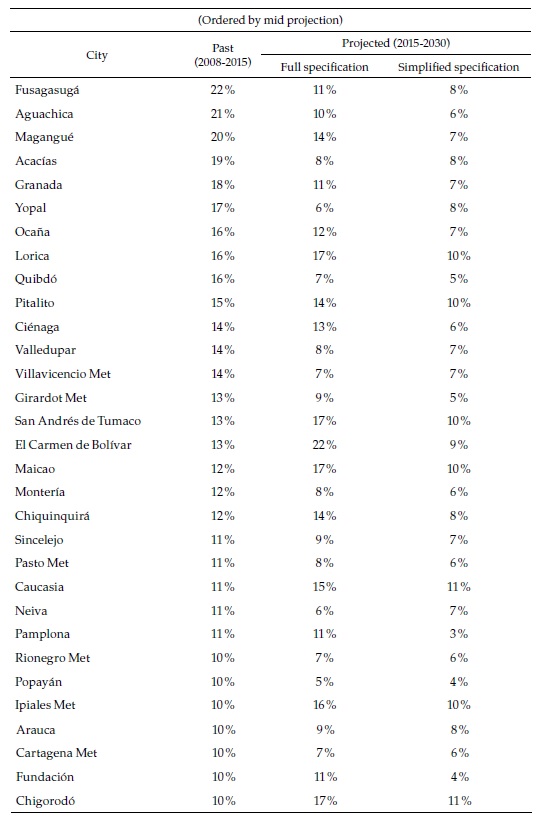
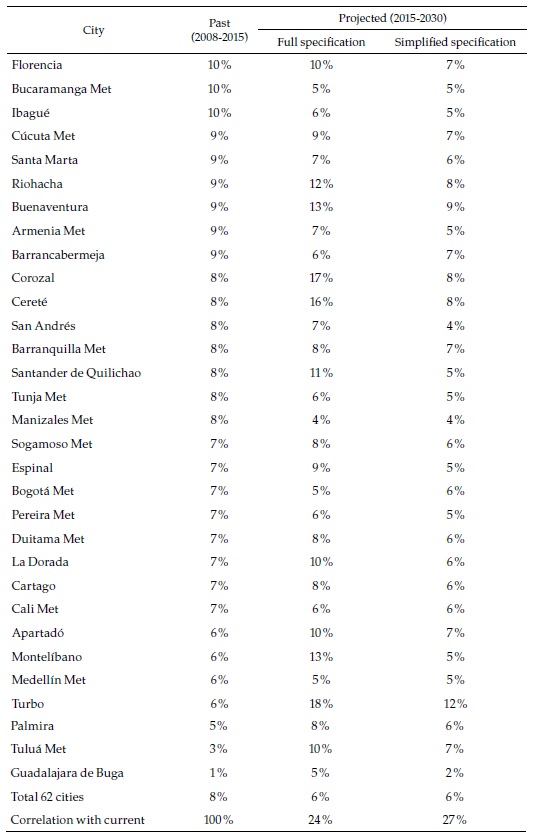
To conclude the presentation of the regression-based forecasts, Table 2 shows the aggregates of the most relevant results. In 2015, the formal employment rate in the urban areas was 34 % of the population of working age, and the average across cities, 22 %. Remember that our definition of formal employment takes into account the actual number of weeks of work of every employee. From this basis, the formal employment rate will probably reach between 63 and 66 % in 2030, and the simple average will be between 43 and 59 %, depending on the regression specification on which the forecasts are based. While formal employment in the 62 cities grew 8 % per year between 2008 and 2015 (or 10.5 % on average), it will probably slow down to a rate of growth of about 6 % in the future (or between 7 and 10 % on average), due to the fact that the largest cities will see more modest rates of formal employment growth. These results suggest that the choice of specification does not make a substantial difference for the (weighted) aggregate of the 62 cities, but this is certainly not the case for the simple averages or for the individual cities, as we have seen. There is where machine learning techniques may be helpful.
Machine Learning Forecasts
Machine learning is a type of artificial intelligence used to predict outcomes from input data without explicitly specifying the relation between the outcomes and the input data. The algorithms used in machine learning are able to discover the patterns in the data that best fit the outcomes, without any theory or model that relates the outcomes and the inputs.
I will use the machine learning technique known as random forest, which is typically applied to predicting categories of an outcome using random subsets of the data to randomly constructed decision trees. A decision tree is simply a step-by-step process to decide a category something belongs.
It should be noted that there are two types of randomness in random forests. One is the random selection of the data in each subset, and the other is the random branching or splitting of the inputs in the subset. The two types of randomness are ways to prevent overfitting and determine how reliable the predictions are (for an intuitive introduction to random forests, see Hartshorn, 2016).
Several decisions must be made to apply the random forest technique. Basically:
The outcome categories must be defined. In this case, the outcome is the dependent variable defined in equation (4), and categories will be its quartiles. Since I use the 434 observations of the 1-year intervals (as in the middle and lower panel regressions in Table 2), each quartile contains 108 or 109 observations. The program’s objective will be to predict the category to which each observation belongs. To check the robustness of the categorization, I categorize the dependent variable in two other ways, using three and six groups, respectively, instead of the original four groups (see further below).
The input data must be selected. I will use the same set of explanatory variables in the “full specification” (listed in the middle panel of Table 2). Since I want to make predictions of the outcome categories for 2030, I also include the input data for that year (the same used in the regression-based forecasts).
The input data categories. Although it is not strictly necessary to “discretize” the input data, it improves the reliability of the results when the number of observations is small, as is the case here. I have constructed deciles of each variable for the 434 observations between 2008 and 2015, except the dummy for oil-producing cities. I then applied the categorization criteria to the 62 observations of the 2030 input data. To check the robustness of the categorization, I “discretize” the relevant variables in two additional ways using five and 15 groups, instead of the original 10 (see further below).
The number of trees or simulations: 1.000.
Other. Although many features of the program may be modified, I have used the default options in the Stata program for random forests.
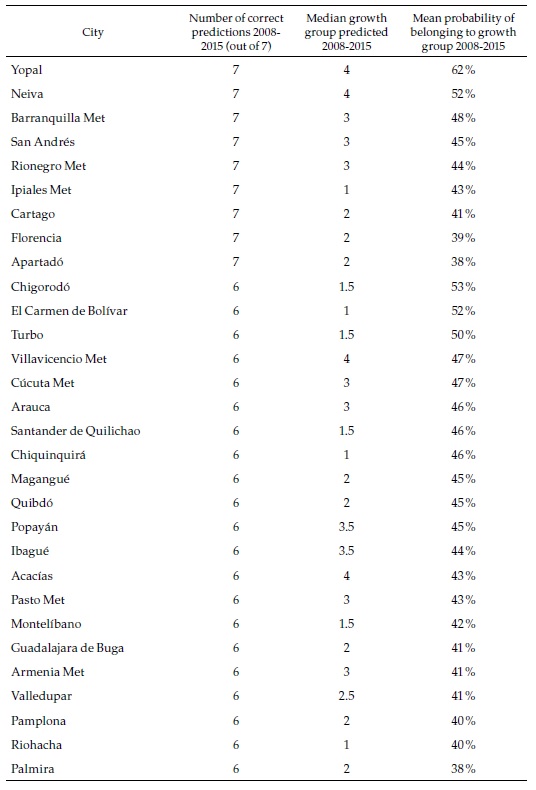
The prediction scores are summarized in Table 3. The “success rate” for the whole sample was 78 %, meaning that the percent of outcomes predicted in the correct outcome category (listed in the first column). The success rates of each of the categories range between 86 % for category 1 (slowest speed of formal employment change) and 72 % for category 4 (fastest). Keep in mind that, since there are four categories, the expected success rate of a completely random prediction would be 25 % in each category (and therefore in the total as well).
The success rate should not be mistaken with the probability that the category predicted for an individual outcome is the correct one. Since each of the 434 individual outcomes will enter in many of the simulations (more exactly 63.2 % of the simulations, see Hartshorn, 2016), the program computes the percent of those cases in which it has made the correct prediction. The last column of Table 3 shows that, on average, that probability is 44 % (and very similar for each of the categories).
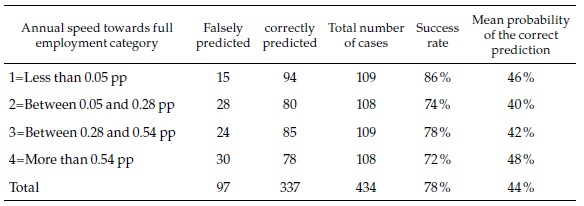
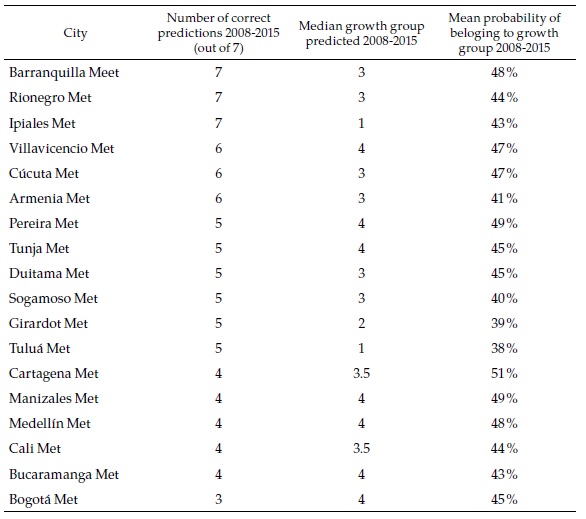
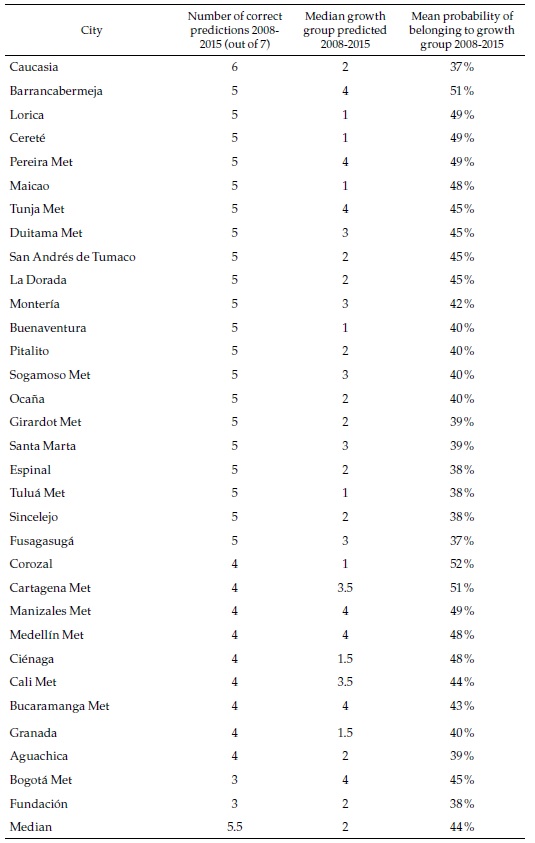
Table 4 presents a summary of the prediction scores for a selection of cities (all of them multi-municipality cities). For three of those, random forest predicts correctly the speed category every year between 2008 and 2015. Although the probability of each of those individual events is moderate (again, around 44 %), the consistency of the prediction suggests that it is highly likely that Barranquilla and Rionegro belong to speed category 3, while Ipiales belongs to speed category 1. At the bottom of the table is Bogotá, with only three correct predictions that it belongs to category 4 (the fastest).
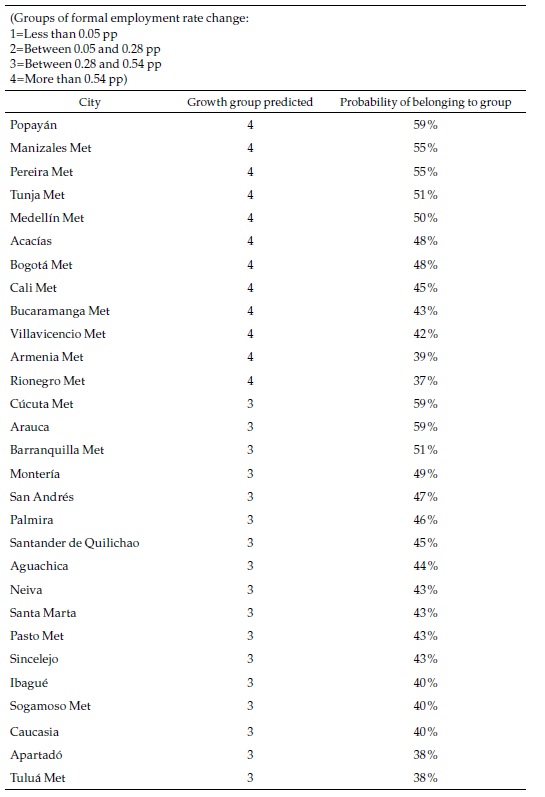
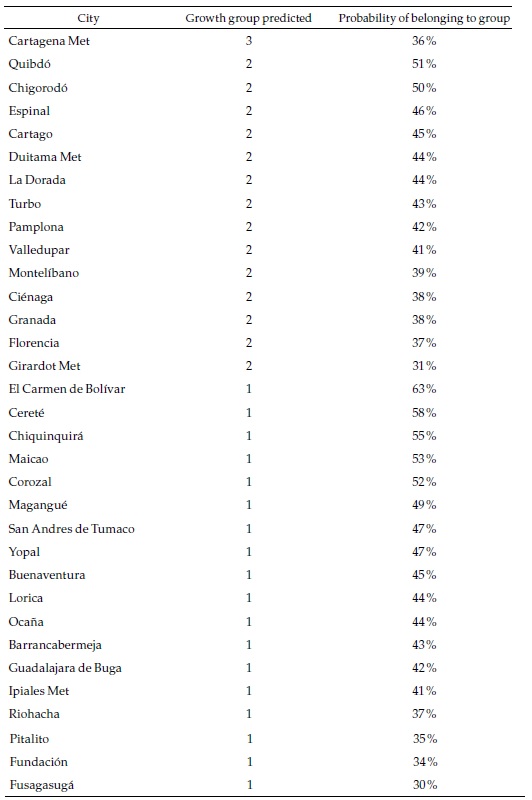
The objective of the exercise is to forecast the speed category of each city in the future. A summary of the results for the same selection of cities is presented in Table 5.
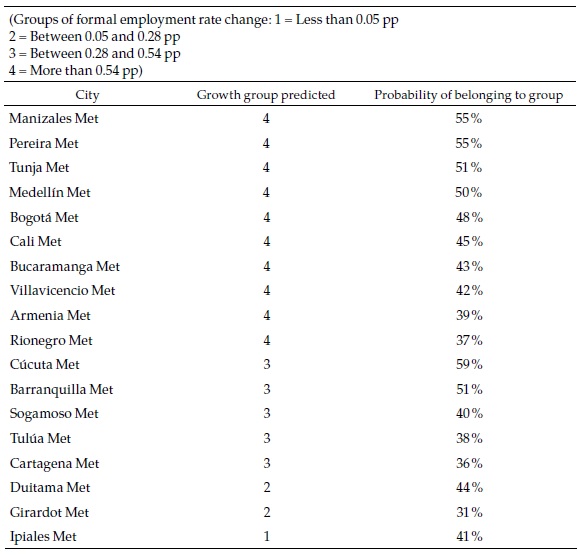
Most of the large cities belong to the fastest category of formal employment growth in the future, which in many cases differ from the past, as we will see below. The probability of that event is relatively high for some of those cities. Only three of the multi-municipality cities are classified in the slower categories. Appendix 5, which presents the complete list of cities, shows that 18 are classified in the slowest category and, in some cases, with high probabilities. Most of those are small cities.
As mentioned, for robustness, I have rerun the machine learning algorithms just explained using two alternative variable categorizations. In the “coarser” categorization, the dependent variable is “discretized” in three categories instead of four, and the explanatory variables are “discretized” in five groups instead of ten. In the “smoother” categorization, the dependent variable is “discretized” in six groups and the dependent variables in 15 groups. With the “coarser” categorization, the “success rate” for the whole sample falls from 78 % to 65 %, and the average probability of the correct predictions falls from 44 % to 36 %. With the “smoother” categorization, the success rate increases to 88 %, while the average probability of the correct predictions is 37 %. Therefore, the original categorization is intermediate between the two alternative ones in terms of the success rate but produces better results than the two alternatives in terms of confidence of the predictions. For this reason, I use it as my preferred categorization; the remainder discussion of the results refers to it.
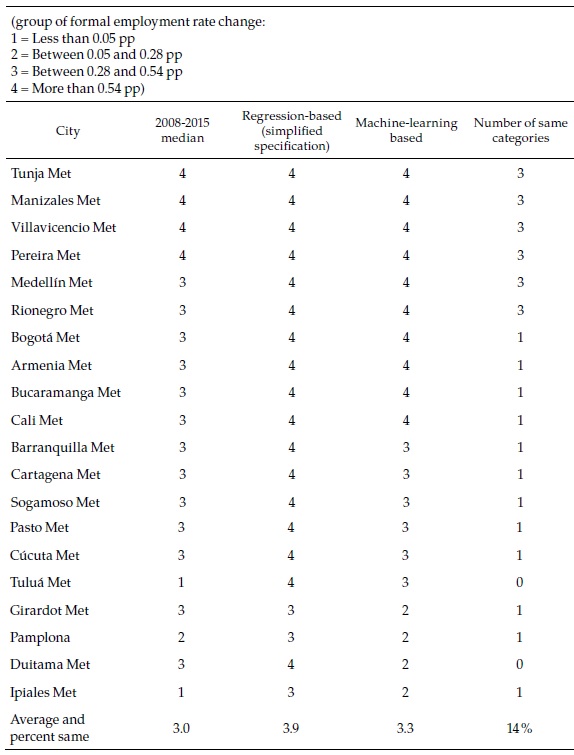
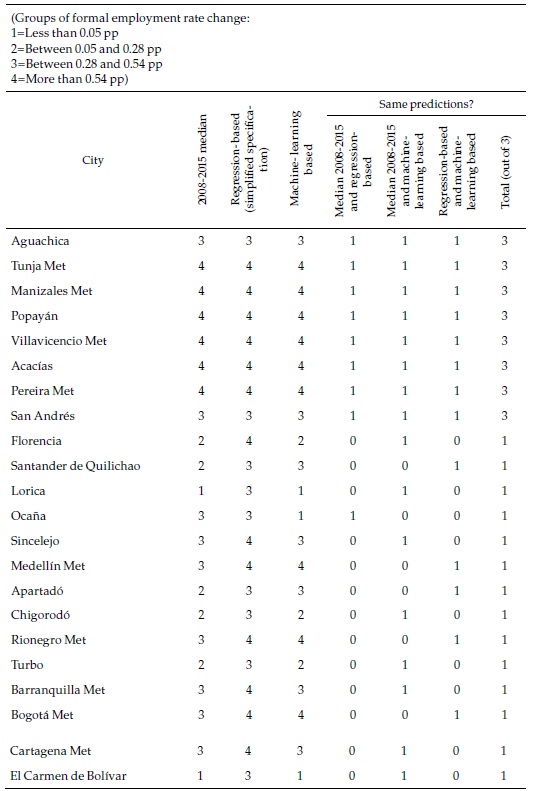
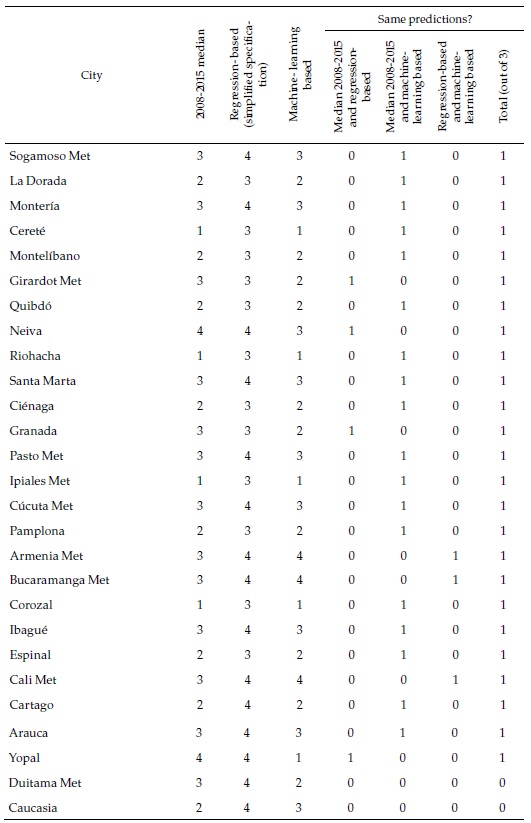
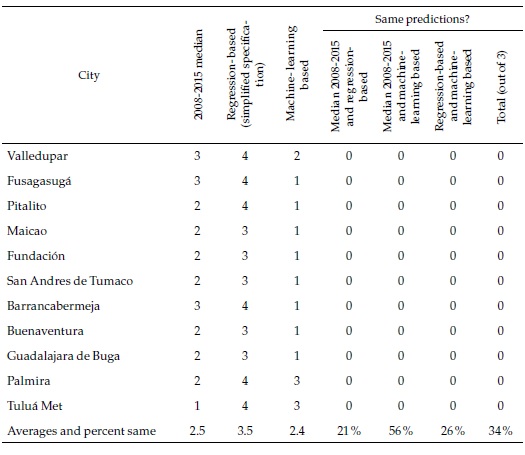
How different are these machine learning forecasts from the regression-based ones and the past records of the cities presented in the previous section? Table 6 focuses again on the same selection of cities used above (complete results can be seen in Appendix 6). As the last column of the table indicates, in only a handful of cities (Tunja, Manizales, Villavicencio, and Pereira), the three classifications coincide. This strongly suggests that the cities belong to the fastest group, where they are consistently classified. The machine-learning-based forecasts are less optimistic than the ones based on the simplified regression or the ones based in the full specification regression, which are all category 4 and not included in the table but more optimistic than what a simple extrapolation of the past would suggest.
While the previous comparisons across methods refer to the speed categories, it is also relevant to compare the forecasts for 2030 of the formal employment rates, to which the sustainable development target of full and decent employment refers. In order to do this, the category predictions by machine learning must be converted into formal employment growth rates and then extrapolated to 2030. To that end, I assume that the value of the dependent variable (speed) in each category corresponds to the median of the category, which I then use to make the calculations. Although it would be desirable to have a different speed for each city, this is not possible with the results of the machine learning technique, which only provides a classification by speed categories. Similarly, the technique does not provide any basis to establish whether a city may jump from one speed-category to another.
Figure 5 compares the forecasts by the three methods of formality rates in 2030. For this reason, the machine-learning forecasts form four straight lines: each one of them corresponds to a speed category. As already mentioned, the machine learning predictions are less optimistic than the regression-based ones. Furthermore, for the cities classified in category 1 (slowest speed), formality rates will not change, according to the machine-learning forecast. Although most of these cities initially have low formality rates, two of them have initial formality rates about the average (Barrancabermeja and Buga), and one of them starts from a very high formality rate (Yopal).
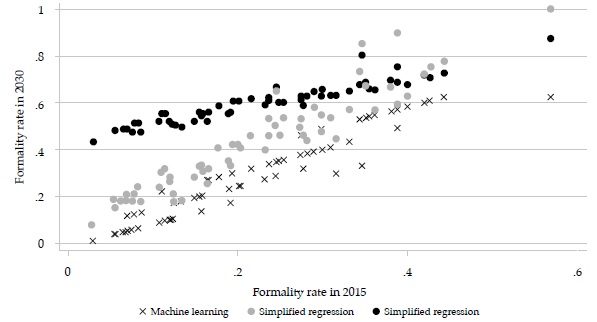

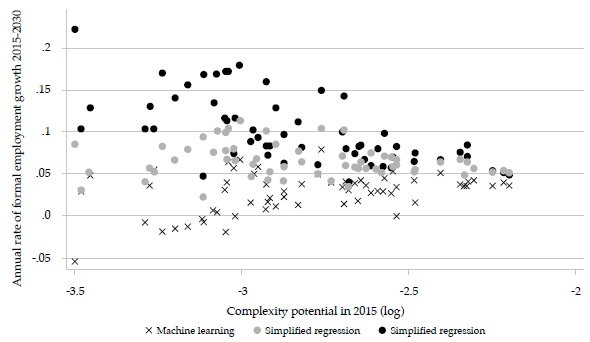
Figure 6 shows that the formal employment growth rates in the three methods are similar for the largest cities but tend to diverge for smaller cities. The same pattern holds in relation to initial complexity potential (Figure 7).
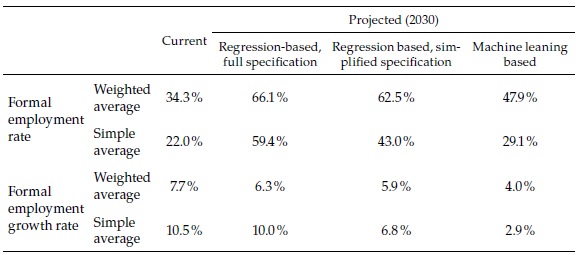
Finally, to conclude the presentation of the results, Table 7 compares the aggregates of the 62 cities from the three methods. The formal employment rate for the aggregate, currently 34.3 %, may reach between 47.9 % and 66.1 %, depending on the forecast method (and the simple average may reach between 29.1 and 59.4 %, starting from 22 %). While in the period 2008-2015, total formal employment in the 62 cities grew 7.7 % per annum, it may be expected to grow in the future between 4 and 6.3 % (simple average between 2.9 and 10 %, compared with 10.5 % in the recent past).
Discussion
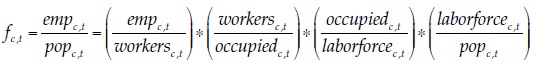
In order to assess the results, it must be recalled that the definition of formal employment used in this paper is not the share of the occupied that had some formal employment or social security in the reference period. With the formal employment criterion used by dane (employees in establishments of more than five workers) and a 3-month (rolling) reference period, the formality rate in 2015 in the 23 largest cities and their metropolitan areas was 50.7 %. With the social security criterion, it was either 64.6 or 46.8 %, depending on whether social security affiliation refers to health or pensions. In any of these definitions, there is only one margin through which the formality rate may increase, which is the status (either formal or informal) of the occupied. In my definition, there are four margins, as can be seen in this expression, which is an expansion of equation (3):
 (5)
(5)
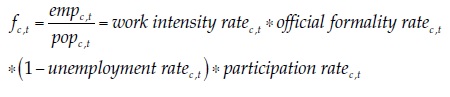 (6)
(6)Where the work intensity rate is the share of the year . that workers on average effectively contribute to the social security system, given my definition of empc, t. My formal employment rate and the official formality rate would move proportionally as long as the three other margins remain unchanged. If so, the official formality rate would go up from a range between 46.8 and 64.6 %, as we have just seen, to a range between 65.3 % and 90.2 % in the machine-learning-based forecast. But this conclusion is unwarranted because, although I have not explicitly modeled the three other margins (i.e., the work intensity, the unemployment, and the participation margins), they are implicitly considered in the forecasts, and it would not be reasonable to expect substantial increases in the official formality rate without increases in the other rates. As argued before, the official definitions of (in)formality are not adequate to assess the feasibility of the sustainable development goal of “full and productive employment and decent work for all women and men”. My definition is much better suited to this end.
Being so, it is abundantly clear from the forecasts that reaching the full employment goal lies much further in the future than 2030. This does not contradict the finding that, most likely, formality rates will increase in most if not all Colombian cities larger than 50.000 inhabitants. Also, it does not deny that the different forecast methods consistently indicate that the formal employment growth rates in the largest cities will be about 5 %. However, there is much less consistency in the predictions for the mid-size and smaller cities, many of which are not very optimistic.
Combining regression-based and machine-learning-based forecasts enrich our understanding of cities formal employment prospects. The main strength of the latter lies not in its ability to predict aggregates for which the regression-based method is better suited but in the nuances it provides on the predictions by city. For some of the smaller cities (such as Carmen de Bolívar and Chiquinquirá), it predicts with confidence that formal employment rates will stagnate at their low initial level, contrary to what the full specification regression would suggest. In other cases (such as Tunja and Popayán), it strongly predicts a fast process of labor formalization, consistent with the still incipient past tendencies, but also with the predictions based on regressions. Yet, in others, the predictions not only differ widely across methods, but those by machine-learning are statistically weak (Fusagasugá, Tulúa).
As argued in the theoretical section and shown in the regression results, complexity potential is the strongest and most consistent predictor of formal employment rate changes in cities. However, the machine-learning method suggests that the relation between the two variables is less straightforward than implicitly assumed in the regression-based methods. Further research is needed to understand how the ability of cities to make use of their skill mix in developing new industries may be affected by urban features such as density, availability of transportation means (however, see O’Clery et al. 2019), women’s access to workplaces, etc.
References
Albrecht, J., Navarro, L., & Vroman, S. (2009). The effects of labour market policies in an economy with an informal sector. The Economic Journal, 119(539), 1105-1129. https://doi.org/10.1111/j.1468-0297.2009.02268.x
Bosch, M., & Maloney, W.F. (2010). Comparative analysis of labor market dynamics using Markov processes: An application to informality. Labour Economics, 17(4), 621-631. https://doi.org/10.1596/1813-9450-4429
De Soto, H. (1989). The other path: The invisible revolution in the Third World. Harper and Row.
De Soto, H. (2000). The mystery of capital: Why capitalism triumphs in the west and fails everywhere else. Basic Books.
Duranton, G. (2015). Delineating metropolitan areas: Measuring spatial labour market networks through commuting patterns. In Watanabe T., Uesugi I. & Ono, A. (Eds.), The economics of interfirm networks. Advances in Japanese business and economics, vol 4 (pp. 107-133). Springer. https://doi.org/10.1007/978-4-431-55390-8_6
Gollin, D., Jedwab, R., & Vollrath D. (2016). Urbanization with and without industrialization. Journal of Economic Growth, 21(1), 35-70. https://doi.org/10.1007/s10887-015-9121-4
Harris, J. R., & Todaro, M. P. (1970). Migration, unemployment, and development: A two-sector analysis. The American Economic Review, 60(1), 126-142. https://www.jstor.org/stable/1807860
Hartshorn, S. (2016). Machine learning with random forests and decision trees: A Visual guide for beginners. Kindle Edition.
Hidalgo, C., & Hausmann, R. (2009). The building blocks of economic complexity. Proceedings of the National Academy of Sciences, 106(26), 10570-10575. https://doi.org/10.1073/pnas.0900943106
Kugler, A., Kugler, M. D., & Herrera-Prada, L. O. (2017). Do payroll tax breaks stimulate formality? Evidence from Colombia’s reform. Economia Journal of the Latin American and Caribbean Economic Association, (Fall), 3-40. http://dx.doi.org/10.3386/w23308
Levy, S. (2008). Good Intentions, bad outcomes: Social policy, informality, and economic growth in Mexico. Brookings Institution Press.
Lewis, W.A. (1954). Economic development with unlimited supplies of labor. Manchester School of Economic and Social Studies, 22(2), 139-191. http://faculty.smu.edu/tosang/pdf/Lewis_1954.pdf
McGuire, T. J., & Bartik, T. J. (1991). Who benefits from state and local economic development policies? w.e. Upjohn Institute. https://www.jstor.org/stable/j.ctvh4zh1q
Meghir, C., Narita, R., & Robin, J-M. (2015). Wages and informality in developing countries. The American Economic Review, 105, 1509-1546. https://doi.org/10.1257/aer.20121110
Neffke, F., & Henning, M. (2013). Skill relatedness and firm diversification. Strategic Management Journal, 34(3), 297-316. https://doi.org/10.1002/smj.2014
O’Clery, N., Prieto Curiel, R., & Lora, E. (2019). Commuting times and the mobilisation of skills in emergent cities. Applied Network Science, 4(1), 118. https://doi.org/10.1007/s41109-019-0235-z
O’Clery, N., Chaparro, J. C., Gómez-Liévano, A., & Lora, E. (2020). Skill diversity and the evolution of formal employment in cities, submitted to Research Policy. Peak Urban.
Rauch, J. E. (1991). Modeling the informal sector formally. Journal of Development Economics, 35(1), 33-47. https://doi.org/10.1016/0304-3878(91)90065-4
Ulyssea, G. (2010). Regulation of entry, labor market institutions and the informal sector. Journal of Development Economics, 91(1), 87-99. https://doi.org/10.1016/j.jdeveco.2009.07.001
Appendix

Notes
1 The datasets have information on age and gender, which I did not use. Unfortunately, it provides no information on education, which prevents us from testing our model predictions vis-à-vis the findings of previous works discussed in the introduction
2 In O’Clery et al. (2020) the measure of complexity potential depends on working age population, while here I am taking the latter as a separate explanatory variable. In this way, the relation between both variables can be explored in the machine learning exercises.
Author notes
* Senior Fellow, Center for International Development (cid), Harvard University and Associate Researcher, Research in Spatial Economics (rise), Universidad Eafit. Principal mail address: Eduardo.A.Lora@gmail.com; secondary mail address: Eduardo_Lora@hks.harvard.edu. Address: 5203 Westbard Avenue, Bethesda-md 20816, USA. Phone: +1-240-893-3142.Comments by Juan Pablo Chauvin, Johanna Fajardo, Ana María Ibáñez, Carmen Pagés, Mauricio Quiñones and participants at seminars held at the Inter-American Development Bank and Universidad Eafit are acknowledged. This research took place thanks to the “Urban peak” Program, with the support of ukri’s Global Challenge, Research Fund (Grant reference: ES/P011055/1).