
Testing the Environmental Kuznets Curve Hypothesis In Iceland: 1960-2010
Prueba de la hipótesis de la curva Kuznets ambiental en Islandia: 1960-2010
Prova da hipótese da curva Kuznets ambiental na Islândia: 1960-2010
Testing the Environmental Kuznets Curve Hypothesis In Iceland: 1960-2010
Revista de Economía del Rosario, vol. 19, no. 1, 2016
Universidad del Rosario
Received: 23 December 2015
Accepted: 20 April 2016
Abstract:
The dynamics of economic growth implies a greater energy and natural resource consumption, because this growth needs a higher requirement for fuel and raw materials to fulfill the increase in production which generates economic growth. However a topic of recent interest in the economic sphere is the consequent environmental degradation that comes parallel to this economic growth. This study seeks to establish the relationship between environmental degradation, economic growth, consumption of energy from fossil fuels and trade liberalization in Iceland between the years 1960-2010 in order to find ways to achieve sustainable development. The Environmental Kuznets Curve (EKC) hypothesis is analyzed, checking its central proposal i. e. a greater economic growth will lead to a certain level from which it will generate a reduction of environmental degradation. This hypothesis is tested by applying the Autoregressive Distributed Lag (ARDL) model; finally the results do confirm the existence of a long-term relationship among all the variables proposed.
JEL classification: Q44, Q53, Q56, Q58.
Keywords ECK, fossil fuel energy, Iceland, CO2, economic growth.
Resumen:
La dinámica del crecimiento económico dentro de un país implica un mayor consumo de energía y recursos naturales a causa de la mayor demanda de combustibles y materias primas para cumplir con el aumento de la producción que este requiere. Sin embargo, un tema de reciente interés en el ámbito económico y de preocupación a nivel mundial es la consecuente degradación del medio ambiente que viene paralela a este crecimiento económico. El presente estudio busca establecer la relación existente entre la degradación del medio ambiente, el crecimiento económico, el consumo de energía a partir de combustibles fósiles y la liberalización del comercio en Islandia entre los años 1960-2010, con el fin de determinar si un desarrollo sostenible es posible. Para lograrlo se hace uso de la hipótesis de la curva Kuznets ambiental (CKA), teniendo como resultado que, efectivamente, un mayor crecimiento económico elevará los niveles de contaminación ambiental por un determinado período de tiempo, hasta alcanzar un punto a partir del cual se generará una reducción de la degradación del medio ambiente, hecho dado por los avances tecnológicos y académicos que el crecimiento precede. Esta hipótesis se comprueba aplicando el modelo autorregresivo de rezagos distribuidos (ARDL). Finalmente, los resultados confirman la existencia de una relación a largo plazo entre todas las variables propuestas.
Clasificación JEL: Q44, Q53, Q56, Q58.
Palabras clave: CKA, energía de combustibles fósiles, Islandia, CO2, crecimiento económico.
Resumo:
A dinâmica do crescimento económico dentro de um país implica um maior consumo de energia e recursos naturais a causa da maior demanda de combustível e matérias-primas para cumprir com o aumento da produção que este requere. No entanto, um tema de recente interesse no âmbito econômico e e de preocupação no nível mundial é a consequente degradação do meio ambiente e que vem paralela a este crescimento econômico. O presente estudo busca estabelecer a relação existente entre a degradação do meio ambiente, o crescimento econômico, o consumo de energia a partir de combustíveis fósseis e a liberalização do comércio na Islândia entre os anos 1960-2010, com o fim de determinar se um desenvolvimento sustentável é possível. Para consegui-lo se faz uso da hipótese da curva Kuznets ambiental (CKA), tendo como resultado que, efetivamente, um maior crescimento econômico elevará os níveis de contaminação ambiental por um determinado período de tempo, até atingir um ponto a partir do qual se gerará uma redução da degradação do meio ambiente, fato dado pelos avanços tecnológicos e acadêmicos que o crescimento precede. Esta hipótese comprova-se aplicando o modelo auto-regressivo de atrasos distribuídos (ARDL). Finalmente, os resultados confirmam a existência de uma relação ao longo prazo entre todas as variáveis propostas.
Classificação JEL: Q44, Q53, Q56, Q58.
Palavras-chave: CKA, energia de combustíveis fósseis, Islândia, CO2, crescimento econômico.
1. Introduction
The change of global or regional climate compared to historical values is what is known as climate change. In recent decades, the constant pursuit of economic growth and indiscriminate consumption of energy resources by society has altered the climate balance of the planet; generating global consequences that affect different areas, both economic and social, to undermine health and safety of the population.
The reflected environmental pollution on global warming, the rising sea levels, acid rain, drought and other problems, it is mainly caused by emissions of CO2 and other gases into the atmosphere. Carbon dioxide acts as a blanket for the planet earth, trapping heat from the sun and heating, but the excessive emission of this is completely harmful and their presence is due to deforestation and burning fossil fuels such as oil, coal and natural gas. Similarly other greenhouse gases like methane and nitrous oxide are released by farming practices, waste management and due to excess of these activities, the air is affected. Data from the International Energy Agency (IEA, 2013) show that the concentration of CO2 in the atmosphere for 2012 was 394 ppmv, representing an increase of 40 % compared to the levels of this gas during the 18th century.
One of the main theories to define the relationship between pollution and an economic growth is known as environmental Kuznets curve (EKC), which seeks to measure the relationship between economic development and environmental degradation, following an inverted U-shape; and thus compare the environmental contamination, determined by CO2 pollution emissions, nitrous dioxide or other problem with the per capita income of a country, which is a measure of development. This theory is based on two main assumptions (1) more economic activity, increased number of releases (2) cleaner technology produces less pollution per unit produced (Grossman & Krueger, 1991). This means that as economic growth increases, pollution will increase, up to a point, where further growth will result in less pollution. According to the International Energy Agency in its journal Energy and Climate Change, 2014 was the first year where global CO2 emissions related to energy have not increased, leading to the fulfillment of the EKC theory.
Significant amount of research that has been published, has tested the EKC hypothesis in single countries, and many of them have found that higher levels of income reduce environmental degradation (Beckerman, 1992; Sun, 1999) and therefore, an economic growth might be compatible and a requirement for environmental improvement if the correct policies are taken (Bhagawati, 1993; Dinda, 2004).
The argument behind EKC hypothesis is that when the levels of the economic development are low, the environmental contamination is restricted to the impacts of the economic activity; as economic growth accelerates with the development of the main activities of the primary sector as agriculture, livestock, fishing, among others and the improvement of industrialization, the rates of resource regeneration are lower than the rates of resource depletion, and thus the amount and toxicity of waste increase; when the levels of economic development reach a certain point, improvements in the dissemination of information to industries and services, along with rising environmental consciousness and better technology, lead to stabilize and gradually decrease environmental degradation (Panayotou, 1993).
Iceland is considered one of the greenest countries in the world, and by 2025 is expected to completely reduce the use of fossil fuels to generate energy in order to use cars with 0 % pollutant emissions; today 20 % of the cars are electric. Almost 100 % of the electricity used by its inhabitants is generated from hydropower, geothermal and other renewable energy sources; and as these sources produce inexpensive electricity, this country can cheaply supply its energy-intensive industry (Orkustofnun, 2013; Davidsdottir, 2007).
This country has great potential for the production of low-cost renewable energy; the geothermal power plants emit CO2 in Iceland because of the volcanic magma degassing (Kauw et al., 2015). The main reason of it is because the country is benefited by its geographical location as it is situated in an area that not only has dozens of active volcanoes, but also has abundant springs which comes out steam and hot water, and it is from there where cleaner and cheaper energy is extracted; due to this cheapest way to generate energy, it has allowed Iceland to be able to develop export industries that depend on energy.
The Kyoto Protocol sets targets related to the reduction of emissions of greenhouse gases specifically for countries that have accepted to be part of those responsible for the increase in these emissions, such as the European Union and other 37 industrialized countries. This agreement was approved in 1997 but entered into force in 2005. Currently Iceland is part of the Kyoto Protocol and has joined the EU and Norway in reducing Greenhouse Gas (GHG) emissions about 30 % by 2020 compared with their status in 1990 (Government of Iceland, 2010).
In order to test the EKC hypothesis, this paper applies the Autoregressive Distributed Lag bounds testing to cointegration to analyze the relationships between CO2 emissions per capita, GDP per capita in constant price (2005) US dollars, trade openness, and energy consumption from fossil fuels in the case of Iceland from 1960 to 2010; this confirms the presence of co-integration within the variables in long term. Moreover the results show that both production and consumption of fossil energy in Iceland have a direct and significant effect on the level of emissions of CO2; additionally the Granger causality test determines that per capita GDP causes CO2 emissions. Finally this model supports that the theory of environmental Kuznets curve is met in Iceland.
This research paper is organized as follows: Section 2 provides information about the country to be analyzed; Section 3 is a literature review highlighting relevant previous studies on the subject; Section 4 details the theoretical framework and model to perform; section 5 defines the methodology that has been used for analysis; Section 6 shows the empirical results and Section 7 concludes.
2. Iceland context
Iceland is located in northwestern Europe and due to its location in the Mid- Atlantic Ridge, this country has a large volcanic and geologic activity which has allowed its climate is temperate and his environment is livable. In 2008 the economy has suffered an important misfortune, which involved the collapse of major financial institutions. Despite this, today Iceland has recovered, its GDP has had significant growth, investment and consumption have increased and unemployment has declined.
According to the Sustainable Governance Indicators (SGI) 2015 Survey, Iceland is ranking 26 internationally regarding to environmental policies. In the past, this country did not treat environmental policy as a top priority on its political agenda, but after the new government came to power in May 2013 led by Sigmundur Davíð Gunnlaugsson, they took more actions on behalf of the country’s nature and natural resources. In that year, the parliament approved a new law, Lög um Náttúruvernd Nº 60, which strengthened the legal framework for the protection of the natural environment; they also adopted a resolution which implemented aspects of the Master Plan Hydro and Geothermal Energy Resources in order to use this resources for power generation (SGI, 2015).
Iceland is considered a world leader in the use of renewable energies and in the treatment and control of environmental pollution, furthermore it is ranked highest (ranking 1) followed by Switzerland, Costa Rica and Sweden according to the Environmental Performance Index 2010 (Emerson et al., 2010). But the 2016 EPI Report shows that innovations have altered some rankings placing Iceland in second place followed by Sweden, Denmark and Slovenia, being Finland the top one (Hsu et al., 2016).
The long-term prospects are favorable for Iceland because it has abundant energy resources, rich fishing grounds, it is considered as a tourist destination and its current economic system has been improving. Currently Iceland depends on the ability to sustainably exploit marine and land resources and their ability to use hydro and geothermal energy. There are companies like Carbon Recycling International, which have taken advantage of the volcanic forces from the area so that the emission of carbon dioxide, considered an agent of climate change, ceases to be a problem and becomes a solution. This company has managed to obtain green fuel from CO2 and has been able to market it, and thanks to the location of Iceland, this has abundant reserves of energy at low cost.
The country has been dedicated to improving the environmental public health, reduce and control emissions of greenhouse gases and increase reforestation. Much of Iceland’s electricity comes from sustainable and clean sources, since the geothermal steam provides heating in buildings and a quarter of the electricity while the rest comes from hydropower; in 2001 the 95 % of the stationary energy and two-thirds of the total energy in this county come from these renewable energy sources (OECD, 2001). Iceland has been named as the cleanest country in the world, and even today, one of the primary and ambitious goals for the government to its economic growth remains the use of clean energy to 100 %.
Iceland endorsed the Kyoto Protocol on May 23th of 2002 and one of the main obligations during the commitment period was to keep Greenhouse Gas emissions within 10 % above 1990 levels, and a long-term vision is to achieve the reduction of GHG emissions by 50-75 % until the year 2050 (Government of Iceland, 2015). The Icelandic government recognize to be responsible for the protection of its environment since they have a unique land to protect; it is why this country has adopted policies which have helped to contribute to fighting global environmental change, i. e. to provide clean energy with the construction of aluminum smelters using hydroelectric power from reservoirs and dams, and thus burn the least amount of fossil fuels that would otherwise (Jóhannesson, 2005).
3. Literature review
Kuznets (1955) was the first one who proposed the Kuznets Curve hypothesis, an inverted U-shaped relationship between economic development, determined by per capita income and income inequality. He argues that in the early stages of economic growth, income inequality increases at the beginning, but as the economy continued to grow, the inequality starts to decline after a turning point i.e., the income distribution becomes more uneven in the early stages of economic development and it then moves to a greater equality as the economy grows.
In the 1990s, literature about the link between the level of environmental quality and economic growth exploded (Grossman & Krueger, 1991; Shafik & Bandyopadhyay, 1992), and based on this hypothesis the Kuznets curve became a means to explain this relation. The relationship of these two variables can be shown by an inverted U-shaped curve, in which the X axis is represented by economic development, determined by GDP per capita, and the Y axis is the environmental degradation, defined by CO2 pollution emissions or another Greenhouse gases as an environmental indicator.
The explanation of this Environmental Kuznets Curve hypothesis is that the awareness of environmental degradation is low in the early stages of economic development, and the actions and policies taken in that time period by the government are not enough to protect the environment; at a certain point this economic growth will lead to a change in the composition of economic activity, from heavy manufacturing to services, and this change will generate a growth in the country’s economy which may also create environmental benefits with the development of new technologies such as, a cleaner production or the improvement of the energy efficiency (Al-Rawashdeh et al., 2014).
In recent decades, advanced industrialized countries are giving more attention to the environment; in the stages of industrialization the government of these countries work to mitigate the environmental damage by implementing policies and, as a result, the quality of the environment begins to improve (Enevoldsen et al., 2007). The correct policies and regulations are one of the main elements that can deal positively with the issue of climate change; research suggests that only when the income rises, it is possible to implement effective environmental policies as long as the casual relationship between economic development and environmental quality is understood (Coondoo & Dinda, 2002).
At present, because of the environmental crisis affecting planet Earth, the issues related to the care of the environment have become highly relevant. Problems related to global warming and climate change caused by emissions of Greenhouse gases arising from human activities which imply the combustion of fossil fuels have been a fact of concern in recent decades (Baumert et al., 2005). The search from nations for a sustainable development is increasing, and in order to achieve this goal, there are increasingly more studies and literature regarding the subject.
The relationship between environmental degradation and economic growth has been the subject of analysis of several researchers who have used different methodologies to validate it. Many have sought to test the effectiveness of the Kuznets Curve Hypothesis using different variables representing existing environmental pollution, taking between major emissions of carbon dioxide (Baek, 2015; Balaguer & Cantavella, 2016; Gupta et al., 2015; Zambrano-Monserrate et al., 2016), nitrous oxide emissions (Miah et al., 2010), the ecological footprint (Al-mulali et al., 2015), among other greenhouse gases. Likewise these studies use different economic development indicators such as Gross Domestic Product (GDP), openness to international trade, foreign direct investment and population density, among others.
In recent years the number of econometric studies that prove the existing relationship in economies around the world, between CO2 emissions, as a measure of environmental degradation, with variables such as GDP, the use of non-renewable energy sources and exposure to international trade is increasing. Halicioglu (2009) examines the relationship between CO2 emissions and the aforementioned variables in Turkey, determining that, it is the income of a State, the variable in greater significance and that directly affects the emissions of CO2, followed by energy consumption and the present level of trade in the country.
Jebli, Youssef, and Ozturk (2016) using panel data of 25 countries belonging to the OECD show that in the long term, there is a relationship between GDP and CO22 emissions, also they show a direct relationship between the consumption of non-renewable energy and such emissions, while there is an inverse relationship between these emissions and exposure to international trade, which is corroborated by results from other studies (Shahbaz & Lean, 2012). Ang (2007) at the same time provides evidence to argue that greater economic growth causes an increased use of energy which in turn is reflected in the growth of long-term pollution.
Jebli and Youssef (2015) analyze the behavior of these variables in Tunisia and show that there is a causal connection in both the short and long term relationship between trade openness of a country and its CO2 emissions, and its effect is positive. Kasman and Duman (2015) show in turn, while examining the causal relationship between carbon dioxide emissions, energy consumption, GDP, trade and urbanization, that these are significant in both the short and long term, and their role is a vital importance to achieve a balance between economic development and environmental care.
It should be stressed the important role of energy consumption in the areas of pollution, for that reason, difference in terms of environmental degradation and consumption of fossil renewable energy has been studied by several scholars. Marrero (2010) examines this relationship using panel data from 24 countries of the European Union, the author proves that the impact of energy consumption on the environment will depend on the source which comes this energy and its final use.
Bölük and Mert (2014) determine in their study that consumption of energy from fossil fuels increases roughly twice the emissions of greenhouse gases in the countries of the European Union in comparison to energy from natural resources. Likewise (Bölük & Mert, 2015) by a study in Turkey, they establish that there is a significant and negative long-term relationship between the consumption of renewable energy and CO2 emissions, but the relationship is positive in the short term and therefore they conclude that the production of energy from renewable sources acts with a lag of the dependent variable.
Long, Naminse, Du, and Zhuang (2015) investigate the effect of economic growth and the use of non-renewable energy in carbon emissions in China from 1952 to 2012, concluding that there is a two-way causality between these emissions and consumption energy from fossil fuels, being especially the energy from the use of coal as the most impact on the environment. On the other hand Saboori, Al-Mulali, and Ozturk (2015) analyze the behavior of these variables for a period of 30 years in Vietnam, determining that while the fossil energy consumption significantly increases the level of contamination of a country, use of non-renewable energy did not represent a significant reduction in pollution.
There are several scholars who have proven the theory of environmental Kuznets Curve. Saboori, Sulaiman, and Mohd (2012) analyze the relationship between CO2 and GDP and demonstrate the existence of an environmental Kuznets Curve in Malaysia, but this study does not provide much information about why this event and they recommend using more variables for the analysis. Apergis and Ozturk (2015) examine the hypothesis of environmental Kuznets Curve for 14 countries in Asia, using as an indicator of contamination level of CO2 emissions, and as independent variables GDP, population density, land, and other indicators institutions; their results support the existence of an inverted U-shaped relationship between income and the level of pollution.
Arouri, Youssef, M’henni, and Rault (2012) investigate the relationship between carbon dioxide emissions, energy consumption and GDP, from 12 countries in the Middle East and North Arica, showing that long-term income and income squared meet the Kuznets Curve, being the United Arab Emirates, Morocco and Tunisia the exception. This confirms that higher income results in a much greater social, economic and technological development of a country, allowing, that after a certain level, pollution starts to decrease.
4. Theoretical and modeling framework
The interaction between the relationship of economic growth in terms of GDP per capita and consumption of non-renewable energy (from fossil fuels) with CO2 emissions have been discussed in many studies. These propose an inverted U-shaped relationship between economic growth and such emissions as an Environmental Kuznets Curve.
The EKC hypothesis suggests that at the beginning, the short-term economic growth negatively affects the environment, but in the long term, once reached a certain level of income, this economic growth begins to cause positive effects in the environment. One of the main reasons why economic growth negatively affects the environment in the short term is that both public and private sectors aim to generate growth but through the creation of more jobs without worrying about the environmental costs (Muhammad et al., 2013a).
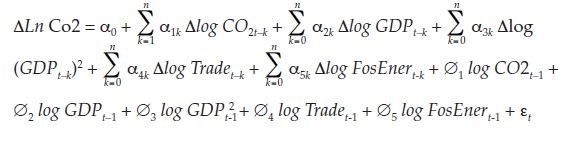
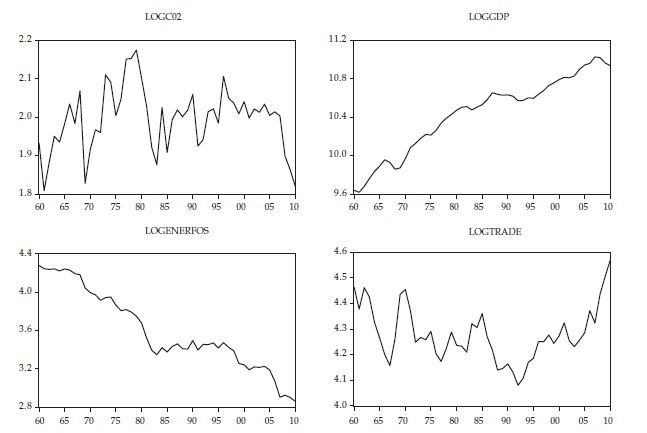
To prove the existence and validity of the hypothesis of the Environmental Kuznets Curve in Iceland, all time series variables become in natural logarithms level in order to obtain effective and consistent results. The log-linear function is specified as follows:
 [1]
[1]Where ln CO 2t is natural log of carbon dioxide (kt) per capita, ln GDPt and (ln GDP)2 t are the per capita GDP and square of the per capita GDP in constant price (2005) US dollars, which are the economic growth proxied, ln Tradet is trade openness measured as the sum of exports and imports of goods and services as share of GDP, ln FosEnert is for energy consumption from fossil fuels and μ t is residual term assumed to be normally distributed.
According to the EKC hypothesis, the fact that β1 > 0 and 0 β2 > 0 means that economic growth increases the emission of CO 2 at the beginning, and this is reduced when the economy has reached its maturity. Muhammad et al. (2013b) argues that a country with an economic growth will lead to increased energy demand (β4 > 0) which will result and increase in carbon emissions. In the present study the Trade Openness variable is considered as a controlling variable. This study uses annual data from 1960 to 2010. Per capita GDP in constant 2005 (US$), Trade as share of GDP, Energy consumption from fossil fuels as share of GDP and CO 2 emission measured in metric tons per capita. All these time series data has been collected from World Bank Database.
5. Methodology ARDL bounds testing of cointegration
In the present study, the focus of Autoregressive distributed lag model (ARDL) is applied to examine the long-term relationship between CO 2 emissions, GDP, exposure to international trade and consumption of fossil energy in Iceland. The ARDL model proposed by Pesaran, Shin, and Smith (2001) develop a solution to the problem of not knowing whether the independent variables in a model time series show a trend or are stationary, either level or first difference. This test is based on the use of statistical F y t for checking the significance of lagged levels. The advantages of this approach over other approaches Cointegration, are that it can be used if the variables are stationary or integrated in a different order. At the same time to correct problems of heterogeneity and serial correlation with increasing appropriate delay. This allows co-integration testing, comparing the values obtained from statistical F table Narayan (2005). If these values are higher than those in the table it means that there is cointegration, i. e. long-term relationship between CO 2 and its determinants.
The long-run relationship among variables can be estimated after the selection of the ARDL model by Schwarz Bayesian Criterion (SBC). The ARDL unrestricted model of Eq. (1) of the model is as follows:
 [2]
[2]where a0 and åt is the drift component and white noise, respectively. α1, α2, α3, α4, and α5 represent the error correction dynamics while and Ø1, Ø2, Ø3, Ø4, and Ø5 correspond to the long-run relationship in base line Eq. (2). In order to have a cointegration, the null hypothesis of no cointegrating should be rejected: H 0 = Ø1 = Ø2 = Ø3 = Ø4 = Ø5 = 0. The alternative hypothesis of cointegration is that at least one of these coefficients is different from zero. To make this happen the F-calculated of the model must be greater than the F-critical imposed by Narayan (2005). Table 2 shows the results of cointegration analysis. After verifying the long-term relationship of the variables, we proceed to calculate the short-term relationship using the following vector ECM model. A general ECM of Eq. (2) is formulated as follows:
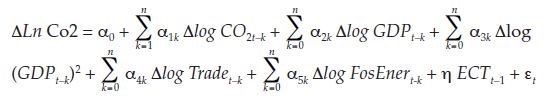 [3]
[3]The presence of the ECTt –1 in the model involves changes in the dependent variable, caused both by variations of the independent variables and the levels of imbalance relative to cointegration. That is, the ECTt –1 allows to correct the imbalance of the dependent variable and adjust it the short term.
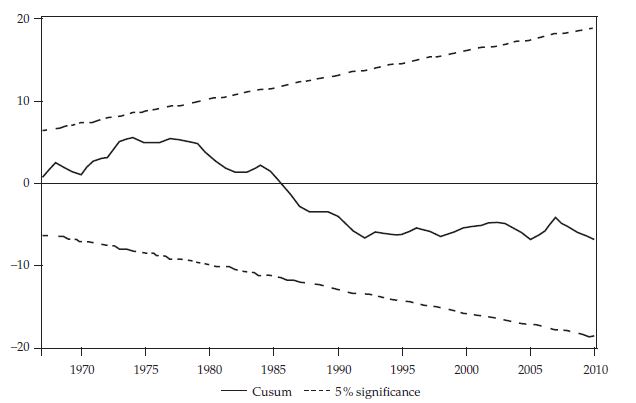
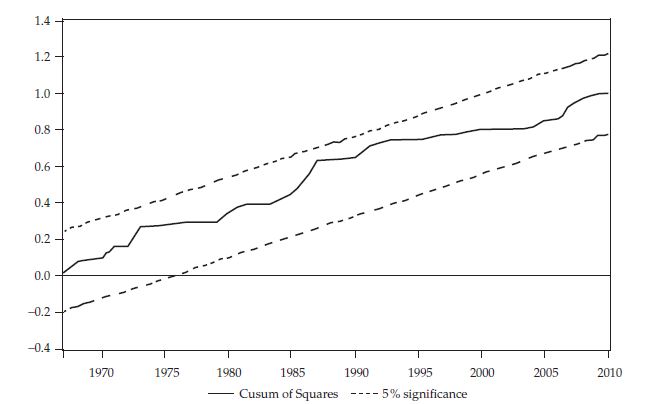
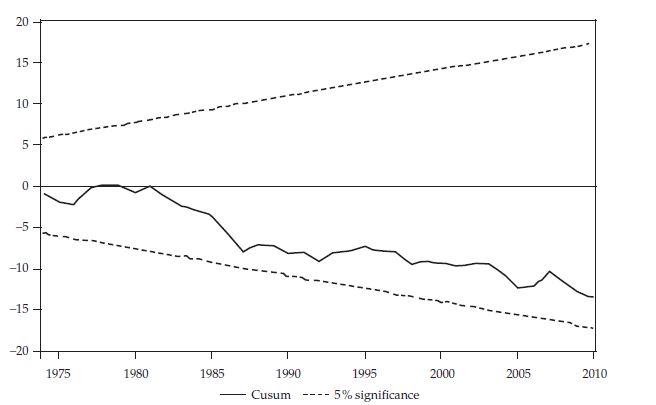
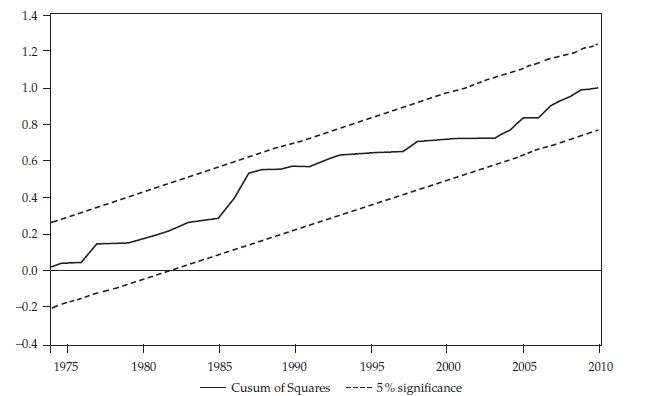
It is important to check the goodness of fit ARDL, so the model should be validated with the corresponding stability tests and diagnosis. To test the stability of the parameters of ARDL, the cumulative sum of recursive residuals (CUSUM) and the cumulative sum of squares of recursive residuals (CUSUMSQ) must be performed. The diagnostic test is done using the test of heteroscedasticity, serial correlation and functionally normal. The model developed in this study is completely validated both the short and long term i. e. that succeeds all diagnostic and stability tests such as the LM test for serial correlation, normality of the residual term and White heteroscedasticity test.
6. Empirical results
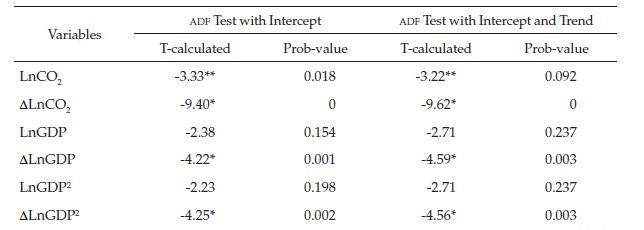
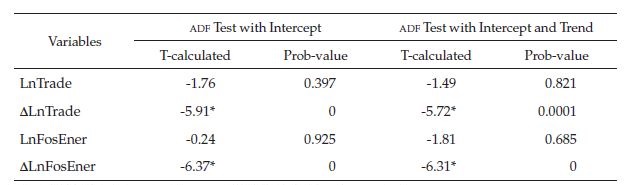
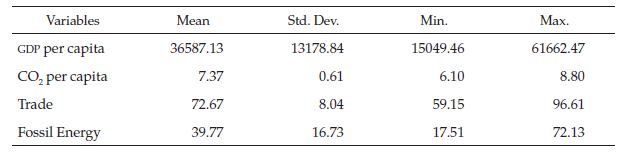
The ADF unit root test is used to test the stationarity of the variables. Table 1 indicates that the only stationary variable at level is CO 2, all other variables are stationary in the first difference. This result shows that the series are integrated I(1), so the ARDL approach is applied to check long-term relationship between the variables. The table 2 presents the main descriptive statistics of the analyzed variables.
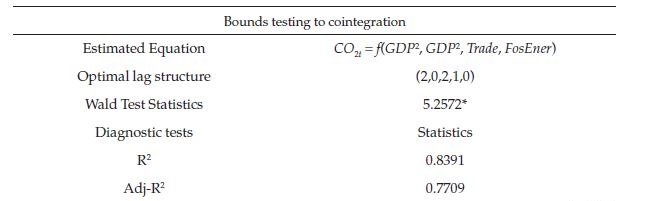
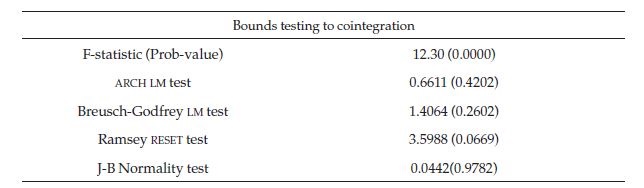
Before checking the variables co-integration of both short and long term is necessary to define the number of lags to be used. So the ARDL model under the lower Bayesian approach value was selected because it is more efficient. The results in Table 3 indicate the optimal lag structure for the model and the F-calculated that was obtained from this. The value of F-calculated is 5.26, which is higher than the F-critical established by Narayan for a sample with more than 40 data, confirming a long-term relationship between CO2, GDP, the use of fossil energy and international trade level in Iceland in this period. In turn the Table 3 contains data about the diagnostic tests and stability made to the model; as evidenced, to a level of significance of 5 % no null hypothesis is rejected, that is to say cases of heteroscedasticity, normality and no serial correlation are not violated, therefore the model does not have functional problems.
Once confirmed the long-term relationship between the variables is possible to determine the marginal effects on CO2 to changes in GDP and energy consumption from non-renewable sources. Table 4 presents the regression results. Both production and consumption of fossil energy in Iceland have a direct and significant effect on the level of emissions of CO2. A 1 % increase in per capita GDP generates an increase of 3.48 % in CO2 emissions. As in previous studies it is evident a strong impact of energy consumption of fossil fuels on the environment. A 1 % increase in consumption of fossil fuels generates a 0.68 % increase in CO2 emissions. The effect of exposure to international trade on CO2 emissions in Iceland is minimal and not significant, suggesting that the export and import goods and services have little or no importance on the environmental situation, however its use as a variable control was necessary.
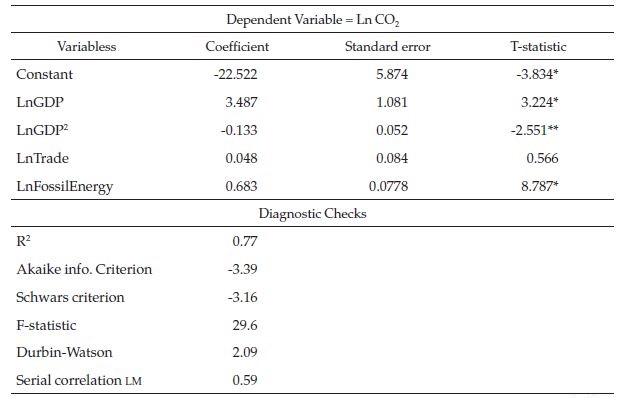

In order to determine the existence of an environmental Kuznets the variable GDP per capita squared curve was added to the model. The sign of the per capita GDP squared is negative and significant, which supports the decoupling of carbon emissions and income per capita, when it reaches a certain level. That finding shows that the theory of environmental Kuznets curve is met in Iceland, is to say that at the beginning an increase of economic growth is reflected in a higher level of environmental pollution, but eventually the situation changes when growth has been enough to get improvements in production, so as to cause less environmental damage.
Existing short-term dynamics are shown in Table 5. The results indicate that consumption of fossil fuels in the short term is positive and significant, meaning that an increase in consumption of this type of energy will have a direct and immediate effect on the level of CO2 emissions to the environment. In this case, a 1 % increase in consumption of fossil fuels lead to increased emissions of CO2 by 0.798 %. The per capita income has a negative effect on short-term pollution and international trade has a positive effect, however the latter effect is statistically significant in both cases.
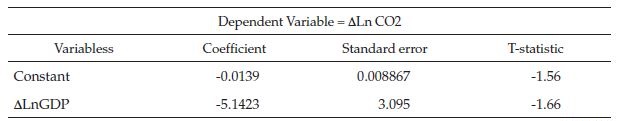
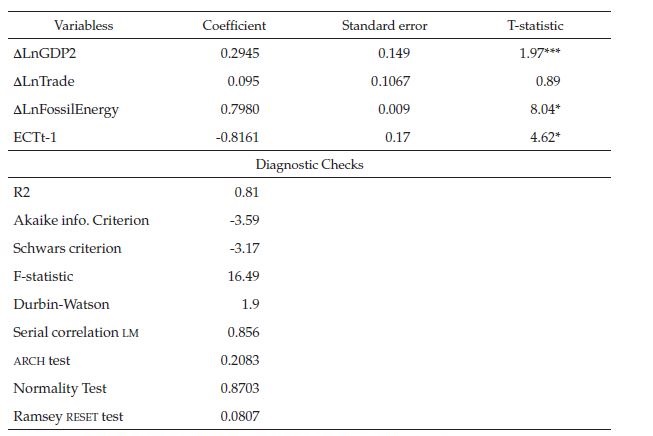
The sign of lag coefficient of the ECT is negative and significant at a significance level of 1 %. This result implies that the imbalance of CO2 emissions have been corrected on an 81.61 % within a year.
Both short- and long-term model was validated correctly and not showing any heteroscedasticity problem, no serial correlation, or poor specification of the functional form. The results are shown in Table 4 and 5 respectively. Figure 1 and 2 show the results of stability test CUSUMQ and CUSUMQ applied to the model. As can be seen the model is stable over time, within the boundary suggest a significant relationship between the dependent and independent variables.
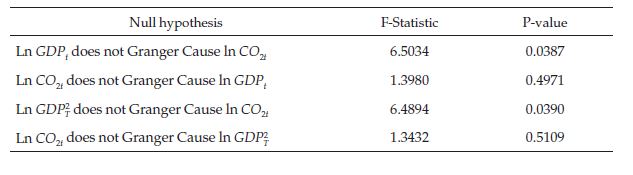
The Granger causality test provides information about the direction of causality between the dependent variable and the independent variables of the model, in this case between the level of CO2 emissions and per capita GDP. The results in Table 6 state that it is per capita GDP that causes CO2 emissions. This result is corroborated by other studies indicating a causal way relationship between GDP and CO2 emissions, Jalil and Mahmud (2009) for China; Shahbaz, Dube, Ozturk, and Jalil (2015) for Portugal, Al-mulali, Tang, and Ozturk (2015) for Latin America and Portugal. The causal link between CO2 emissions and consumption of fossil energy has been established by several studies showing that there is a two-way causality between these two variables (Jebli et al., 2016; Tugcu et al., 2012).
7. Discussion and policy implication
Due to the great importance that it has acquired the issues of environmental protection and sustainable development in recent years, this paper has sought to establish the relationship between environmental degradation and economic growth, in order to find possible means to achieve sustainable development. In this article the relationship between economic growth, consumption of energy from fossil fuels, exposure to international trade and carbon emissions in Iceland between the years 1960-2010 is investigated. The hypothesis of an environmental Kuznets curve present in this country is tested through the application of a test model ARDL. The results verify the existence of a long-term relationship among all the variables proposed.
It was found that a significant direct relationship between consumption of energy from non-renewable sources and levels of CO2 emissions in both the short and long term, that is, to a greater consumption of this type of energy, the level of pollution will increase, causing a negative impact on the environment. Openness to trade is not a significant determinant for the level of contamination, but its inclusion in the model was necessary as it acts as a control variable. It is also a one-way causality between GDP and CO2 emissions. The existence of an environmental Kuznets curve in Iceland, shows that even though an increase of economic growth at the beginning results in a higher level of pollution, it reaches a point where growth translates into lower CO2 emissions. It should be noted that this does not mean that countries with a higher level of income have lower levels of pollution, for this scenario to happen, that higher income should translate into a greater social and technological development to improve the efficiency of processes production, a higher level of environmental policies and a greater knowledge and awareness of the population on the issue.
For Iceland succeeds in reducing CO2 emissions should: i) increase renewable energy sources in the country, that is investing in the construction of new and more energy sources such as hydroelectric, wind, among others, so that in this way the consumption of energy from fossil fuels is minimal; ii) likewise it is vital that Iceland continue implementing environmental policies to protect it and strengthen its environmental infrastructure, investing in clean technologies, so that manages to reduce CO2 emissions; iii) strengthening environmental regulations, introducing better environmental management system to help in the control of the emission discharge of pollution and the excess waste from the industries, disseminating the necessary information to citizens to raise awareness about environmental degradation and to clean up polluted sites; and iv) to take care and continue investing in its green areas given that after its forestry strategy was presented in January 2013, the total area of forest in this country has doubled or even tripled since 1950 (Eysteinsson, 2013), changing its landscape to a productive and functioning ecosystems, creating effective habitats for a variety of flora and fauna, while mitigating climate change in the process.
References
Al-mulali, U., Tang, C. F., & Ozturk, I. (2015). Estimating the environment Kuznets curve hypothesis: evidence from Latin America and the Caribbean countries. Renewable and Sustainable Energy Reviews, 50, 918-924.
Al-mulali, U., Weng-Wai, C., Sheau-Ting, L., & Mohammed, A. H. (2015). Investigating the environmental Kuznets curve (EKC) hypothesis by utilizing the ecological footprint as an indicator of environmental degradation. Ecological Indicators, 48, 315-323.
Al-Rawashdeh, R., Jaradat, A. Q., Al-Shboul, M. (2014). Air pollution and economic growth in MENA countries: testing EKC hypothesis. Environmental Research, Engineering and Management, 4(70), 54-65.
Ang, J. B. (2007). CO2 emissions, energy consumption, and output in France. Energy Policy, 35(10), 4772-4778.
Apergis, N., & Ozturk, I. (2015). Testing environmental Kuznets curve hypothesis in Asian countries. Ecological Indicators, 52, 16-22.
Arouri, M. E., Youssef, A. B., M’henni, H., & Rault, C. (2012). Energy consumption, economic growth and CO2 emissions in Middle East and North African countries. Energy Policy, 45, 342-349.
Baek, J. (2015). Environmental Kuznets curve for CO2 emissions: the case of Arctic countries. Energy Economics, 50, 13-17.
Balaguer, J., & Cantavella, M. (2016). Estimating the environmental Kuznets curve for Spain by considering fuel oil prices (1874-2011). Ecological Indicators, 60, 853-859.
Baumert, K. A., Herzog, T., & Pershing, J. (2005). Navigating the numbers: greenhouse gas data and international climate policy. World Resources Institute.
Beckerman, W. (1992). Economic growth and the environment: whose growth? whose environment? World Development, 20, 481-496.
Bhagawati, J. (1993). The case for free trade. Scientific American, 269(5), 42-47.
Bölük, G., & Mert, M. (2014). Fossil & renewable energy consumption, GHGs (greenhouse gases) and economic growth: evidence from a panel of EU (European Union) countries. Energy, 74, 439-446.
Bölük, G., & Mert, M. (2015). The renewable energy, growth and environmental Kuznets curve in Turkey: an ARDL approach. Renewable and Sustainable Energy Reviews, 52, 587-595.
Coondoo, D., & Dinda, S. (2002). Causality between income and emission: a country group-specific econometric analysis. Ecological Economics, 40(3), 351-367.
Davidsdottir, B. (2007). Sustainable energy development: Iceland as a case study. ACEEE Summer Study on Energy Efficiency in Industry, 3, 26-38.
Dinda, S. (2014). Environmental Kuznets curve hypothesis: a survey. Ecological Economics, 49(4), 431-455.
Emerson, J., Esty, D. C., Levy, M. A., Kim, C. H., Mara, V., de Sherbinin, A., & Srebotnjak, T. (2010). 2010 Environmental Performance Index. New Haven: Yale Center for Environmental Law and Policy.
Enevoldsen, M. K., Ryelund, A. V., & Andersen, M. S. (2007). Decoupling of industrial energy consumption and CO2-emissions in energy-intensive industries in Scandinavia. Energy Economics, 29(4), 665-692.
Eysteinsson, T. (2013). Forestry in a Treeless Land (4th ed.).Egilsstaðir, Iceland: Iceland Forest Service, 2013.
Government of Iceland (2010). Iceland’s Fifth National Communication: under the United National Framework Convention on Climate Change. Reykjavik: Ministry for the Environment.
Government of Iceland (2015). Iceland’s Sixth National Communication and First Biennial Report: under the United National Framework Convention on Climate Change. Reykjavik: Ministry for the Environment.
Grossman, G. M., & Krueger, A. B. (1991). Environmental impacts of a North American free trade agreement (Nº w3914). National Bureau of Economic Research.
Gupta, R., Nasr, A. B., & Sato, J. R. (2015). Is there an environmental Kuznets curve for South Africa? A co-summability approach using a century of data. Energy Economics, 52, 136-141.
Halicioglu, F. (2009). An econometric study of CO2 emissions, energy consumption, income and foreign trade in Turkey. Energy Policy, 37(3), 1156-1164.
Hsu, A., et al. (2016). 2016 Environmental Performance Index. New Haven, CT: Yale University. Available: http://www.epi.yale.edu .
Jalil, A., & Mahmud, S. F. (2009). Environment Kuznets curve for CO2 emissions: a cointegration analysis for China. Energy Policy, 37(12), 5167-5172.
Jebli, M. B., & Youssef, S. B. (2015). The environmental Kuznets curve, economic growth, renewable and non-renewable energy, and trade in Tunisia. Renewable and Sustainable Energy Reviews, 47, 173-185.
Jebli, M. B., Youssef, S. B., & Ozturk, I. (2016). Testing environmental Kuznets curve hypothesis: the role of renewable and non-renewable energy consumption and trade in OECD countries. Ecological Indicators, 60, 824-831.
Jóhannesson, I. Á. (2005). Icelandic nationalism and the Kyoto Protocol: an analysis of the discourse on global environmental change in Iceland. Environmental Politics, 14(4), 495-509.
Kasman, A., & Duman, Y. S. (2015). CO2 emissions, economic growth, energy consumption, trade and urbanization in new EU member and candidate countries: a panel data analysis. Economic Modelling, 44, 97-103.
Kauw, M., Benders, R. M., & Visser, C. (2015). Green methanol from hydrogen and carbon dioxide using geothermal energy and/or hydropower in Iceland or excess renewable electricity in Germany. Energy, 90, 208-217.
Kuznets, S. (1955). Economic growth and income inequality. The American Economic Review, 45(1), 1-28.
Long, X., Naminse, E. Y., Du, J., & Zhuang, J. (2015). Nonrenewable energy, renewable energy, carbon dioxide emissions and economic growth in China from 1952 to 2012. Renewable and Sustainable Energy Reviews, 52, 680-688.
Marrero, G. A. (2010). Greenhouse gases emissions, growth and the energy mix in Europe. Energy Economics, 32(6), 1356-1363.
Miah, M. D., Masum, M. F., & Koike, M. (2010). Global observation of EKC hypothesis for CO2, SOx and NOx emission: a policy understanding for climate change mitigation in Bangladesh. Energy Policy, 38(8), 4643-4651.
Muhammad, S., Mihai, M., & Parvez, A. (2013). Environmental Kuznets curve in Romania and the role of energy consumption. Renewable and Sustainable Energy Reviews, 18, 165-173.
Narayan, P. K. (2005). The saving and investment nexus for China: evidence from cointegration tests. Applied Economics, 37(17), 1979-1990.
OECD (2001). Environmental performance reviews. Paris: OECD Publishing.
Orkustofnun (2013). Energy statistics in Iceland 2013. Reykjavík: Orkustofnun.
Panayotou, T. (1993). Empirical tests and policy analysis of environmental degradation at different stages of economic development (Nº 292778). International Labour Organization.
Pesaran, M. H., Shin, Y., & Smith, R. J. (2001). Bounds testing approaches to the analysis of level relationships. Journal of Applied Econometrics, 16(3), 289-326.
Saboori, B., Al-Mulali, U., & Ozturk, I. (2015). Investigating the environmental Kuznets curve hypothesis in Vietnam. Energy Policy, 76, 123-132.
Saboori, B., Sulaiman, J., & Mohd, S. (2012). Economic growth and CO2 emissions in Malaysia: a cointegration analysis of the environmental Kuznets curve. Energy Policy, 51, 184-191.
SGI (2015). 2015 environment report: environmental policy. Bertelsmann Stiftung.
Shafik, N., & Bandyopadhyay, S. (1992). Economic growth and environmental quality: time-series and cross-country evidence (Vol. 904). World Bank Publications.
Shahbaz, M., & Lean, H. H. (2012). Environmental Kuznets curve hypothesis in Pakistan: cointegration and granger causality, renewable and sustainable. Energy Reviews, 16, 2947-2953.
Shahbaz, M., Dube, S., Ozturk, I., & Jalil, A. (2015). Testing the environmental Kuznets curve hypothesis in Portugal. International Journal of Energy Economics and Policy, 5, 475-481.
Sun, J. W. (1999). The nature of CO2 emission Kuznets curve. Energy Policy, 27, 691-694.
Tugcu, C. T., Ozturk, I., & Aslan, A. (2012). Renewable and non-renewable energy consumption and economic growth relationship revisited: evidence from G7 countries. Energy Economics, 34, 1942-1950.
Zambrano-Monserrate, M. A., García-Albán, F. F., & Henk-Vera, K. A. (2016). Bounds testing approach to analyze the existence of an environmental Kuznets curve in Ecuador. International Journal of Energy Economics and Policy, 6(2), 159-166.
Appendix
Additional information
Para
citar este artículo: Zambrano-Monserrate, M. A., Troccoly, A., &
Pacheco-Borja, M. J. (enero-junio, 2016). Testing the environmental Kuznets
curve hypothesis in Iceland. Revista de
Economía del Rosario, 19(1), 5-28. Doi:
dx.doi.org/10.12804/revistas.urosario.edu.co/economia/a.5239