A well-functioning banking system is vital for economic growth, serving as a conduit for credit intermediation and financial stability. It provides information on potential investments, enhances resource allocation, and promotes trading and risk management (Beck and Levine, 2005). However, many major oil producers face underdeveloped financial systems, which limit their capacity to diversify economically and secure investment funds. In these contexts, particularly where state-owned companies dominate the oil industry, governments often resort to financial repression intervening in financial markets to lower borrowing costs for quasi-fiscal activities1 (Menaldo, 2015).
Financial repression involves direct government intervention in the financial sector to implicitly tax financial institutions. This intervention is not primarily driven by the need to address credit market imperfections; rather, it arises from fiscal challenges. Governments implement strategies such as interest rate controls to finance their operations at lower costs. As a result, they depend on the implicit taxation of the financial sector due to difficulties in raising funds through more conventional means2 (Montiel, 2011).
In this paper, we analyze whether countries with significant oil rents, national oil companies,3 and a fiscal dependence on oil revenue tend to use interest rate controls to reduce financing costs for the non-financial public sector. Specifically, as oil rent becomes increasingly important for the sustainability of public finances in a given country, there are greater incentives to implement various measures that repress the financial system.
Luong and Weinthal (2010) argue that mineral-rich countries often lack the institutional constraints needed to prevent ruling elites from relying on oil rents and engaging in excessive public spending. As a consequence, these countries struggle to establish strong fiscal regimes that support sound macroeconomic policies, which are crucial for coping with adverse oil price shocks. The authors argue that mineral-rich states are cursed by the public ownership models they adopt to manage their mineral wealth. Similarly, Brunnschweiler and Poelhekke (2021) find that domestic (public) ownership tends to result in lower levels of investment in exploration. Additionally, national oil companies typically operate in a protected domestic market, limiting their exposure to competition. Moreover, oil firms under public ownership often enjoy better access to international capital markets and, as a result, rely less on the financial services provided by domestic banking systems (Wolf, 2009).
Resource-rich countries, particularly those with high oil revenues, often exhibit low levels of financial system development. Mlachila and Ouedraogo (2020) identify several explanations for this phenomenon, commonly referred to as the financial curse.4 One explanation is the concentrated structure of oil-rich economies, which exposes them to terms-of-trade shocks (Hausmann and Rigobon, 2003). In such environments, banks tend to demand higher interest rates, making credit more expensive. Additionally, the Dutch disease effect reallocates productive resources toward the nontradable sector, thereby reducing both productivity growth and credit availability (Benigno and Fornaro, 2013).
Another factor is the misuse of windfalls; when revenues are used primarily for consumption smoothing, this discourages the development of a robust financial system (Gylfason, 2006). Furthermore, weak institutions for contract enforcement make banks reluctant to lend. The effectiveness of enforcement and the reliability of the financial sector require credible institutions, which are often compromised by rent-seeking and corruption (Bhattacharyya and Hodler, 2014).
Evidence from oil-dependent countries supports the notion of low financial development. For instance, Berglof and Lehmann (2009) find that in Russia, bank lending plays a limited role in corporate investment. Similarly, Samargandi et al. (2014) develop a composite indicator of financial development for Saudi Arabia, demonstrating that its banking sector remains underdeveloped. Elhannani et al. (2016) show that while financial development has enhanced economic growth in Algeria, it has not mitigated the negative effects of oil rents. Gylfason and Zoega (2001), Nili and Rastad (2007), (Bhattacharyya and Hodler, 2014), Beck (2011)), Kurronen (2015), Beck and Poelhekke (2023), and Mlachila and Ouedraogo (2020) provide empirical evidence that the banking sector tends to be smaller in resource-dependent economies. They cite several reasons for these findings. A high share of mineral exports in total exports reduces the level of bank credit to the private sector, while weak contract enforcement in countries with low levels of democracy further exacerbates the problem. Additionally, they provide evidence that financial sector growth slows in resource-rich countries during commodity price shocks, due to repressed financial systems and weak governance structures.
The ownership structure of oil-extracting companies in petroleum-rich states such as Russia, Azerbaijan, Kazakhstan, Turkmenistan, and Uzbekistan reveals significant insights into how oil wealth impacts state institutions Luong and Weinthal (2010). In these countries, when the government plays a dominant role over the oil industry-often through state ownership or centralized control-state institutions tend to weaken. This centralization of oil wealth can hinder political and economic development, as it reduces the incentive for the government to diversify its economy or engage its citizens in governance. The direct flow of oil revenues into state coffers undermines governmental accountability. Since these revenues come from external sources rather than domestic taxation, the state has less incentive to respond to the needs and demands of its citizens. This dynamic can foster a lack of transparency, weaken civic engagement, and ultimately produce a governance structure that is less responsive to the populace (Ahmadov, 2013).
Brunnschweiler and Poelhekke (2021) examine the influence of oil company ownership from 1867 to 2008 and find a strong positive relationship between shifts to Foreign (private) and Partnership (with over 50 % domestic shares) ownership regimes and increased exploration and discoveries. In contrast, nationalization leads to a decline in these activities. Overall, their findings suggest that oil wealth weakens state institutions when the government has a dominant role in the industry, and domestic (public) ownership reduces investment in exploration, resulting in fewer discoveries. The negative impact of National Oil Companies (NOC) on economic development and exploration activities can be attributed to insufficient public resources for these projects.
Nations with substantial oil rents and state-owned oil companies may become overly reliant on these resources. As a result, when oil revenues decline, these governments might turn to alternative financing methods beyond tax collection or debt issuance-such as financial repression. This research seeks to explain the underdevelopment of the financial sector in oil-rich countries and to examine whether the ownership structure of resource companies influences the relationship between natural resource wealth and financial development. Specifically, the research addresses the following questions: Does the ownership structure of oil companies affect the relationship between natural resource endowment and financial development? If so, are countries with abundant oil resources and publicly owned national companies more likely to rely on financial repression?
In exploring the scope of financial repression, Abiad et al. (2009) explains that state intervention in the financial sector was prominent in both developing and developed countries until the 1980s, with many banks owned or controlled by the government and interest rates regulated. Theoretical arguments for financial repression point to market failures and information frictions. Although many countries liberalized their financial sectors after the 1980s, the 2008-09 global financial crisis reignited debates on government regulation to safeguard financial stability (Jafarov et al., 2019). Additionally, the Covid-19 pandemic resulted in the largest single-year surge in global debt since 1970 (Kose et al., 2022), prompting renewed debate on financial repression as a second-best solution to lower debt levels. By imposing interest rate ceilings, governments can lower borrowing costs for the non-financial public sector. However, such measures weaken price signals in the credit market, distorting resource allocation for investment and hindering overall financial development.
In their assessment, Jafarov et al. (2019) evaluate government-mandated limits on interest rates, reflecting the resurgence of financial repression measures. They extended the database compiled by Abiad et al. (2009), which covers 90 jurisdictions from 1973 to 2005, and extended it until 2017. This extension is limited to the interest rate ceiling indicator due to data constraints. They evaluated the impact of interest rate controls on per capita real GDP growth rate using panel data analysis, estimating that such controls may reduce economic growth by 0.4 to 0.7 percentage points.
To address our research questions, we use the database compiled by Jafarov et al. (2019), which records the presence of interest rate controls across 90 countries from 1973 to 2017, highlighting the significance of administrative and legal controls on interest rates. To test the hypothesis, we employ the GMM dynamic panel system estimator, chosen for its suitability given the inertia of financial indicators, which tend to vary little between successive years (Mlachila and Ouedraogo, 2020). Additionally, the use of GMM is justified by the existence of unobservable country-specific characteristics, the presence of a lagged endogenous variable among the explanatory variables, and the fact that the total number of countries analyzed exceeds the number of years.
This document departs from previous literature by proposing an alternative explanation for the lower financial development of oil-rich countries. It does so by endogenizing the decision to implement interest rate controls as a response to fiscal dependence on oil revenues, particularly when oil companies are state-owned. In contexts of low institutional quality, this fiscal dependence exposes governments to adverse shocks in oil revenues. Consequently, these governments often resort to financial repression to cover their financing needs, which in turn slows down the development of the financial system.
Our working hypothesis is that when a government's fiscal revenues predominantly derive from oil rents, public scrutiny over the use of these resources tends to diminish. This lack of oversight arises as the government becomes less reliant on non-oil tax revenue, reducing the need for accountability to citizens. As a result, this can lead to a concentration of power in the executive branch, facilitating autocratic governance that can capture and distribute oil rents without significant checks and balances.
In this context, the complete control of exploration, production, and revenue distribution by National Oil Companies (NOC) further worsens the problem. Findings indicate that the interplay between substantial oil revenues and the presence of NOC can adversely affect financial system development, potentially stifling financial innovation, limiting access to capital, and hindering overall economic diversification.
Our contribution is to provide an explanation specifically for the lower level of banking system development in oil-producing countries. This is linked to the public ownership of oil companies in an environment characterized by significant oil revenues and low institutional quality, leading to a significant dependency of public sector finances on oil revenues. In this context, domestic pressure to increase public spending-combined with negative fluctuations in the transfers from national oil companies (NOC) to the government5- creates incentives for governments to seek revenue outside traditional tax channels to finance quasi-fiscal activities. Financial repression is one of the most commonly used tools in such cases. To our knowledge, no existing research explores credit deepening in countries with national oil companies and abundant oil resources through the lens of financial repression driven by fiscal dependence on oil revenues.
The document is organized as follows. Section two explains the empirical strategy, including data, methodology, sample, and our definition of fiscal dependence. Section Three discusses the model specification and econometric results, and Section Four presents the concluding remarks.
Data
This study seeks to determine whether abundant oil revenues and national companies managing their exploitation stimulate financial repression, thereby negatively affecting financial development. According to the International Monetary Fund (IMF) (Sahay et al., 2015), financial development is defined as a combination of depth (size and liquidity of markets), access (the ability of individuals to access financial services), and efficiency (the ability of institutions to provide financial services at low cost and with sustainable revenues, along with the level of activity of capital markets).
This definition reflects the complexity of financial development, which involves various aspects of credit intermediation. While using a simple depth indicator, such as the ratio of credit to the private sector to GDP, is limited, it has the advantage of being readily available over the study period. Despite its shortcomings, our analysis will use this ratio as a proxy measure of financial development, with data sourced from the World Bank's World Development Indicators (WDI).
We use an unbalanced panel of 90 countries over the period from 1973 to 2017. We draw on the database compiled by Jafarov et al. (2019), which provides information on the presence of interest rate controls (IRC) in both lending and deposit markets. This qualitative index captures the extent of administrative or legal controls on interest rates, ranging from 0 (strictest controls) to 3 (full liberalization, where banks are free to set their interest rates). IRC serves as the variable to account for financial repression. Interest rate controls distort the allocation of loanable funds: caps on lending rates prevent capital from flowing to its most productive uses, while ceilings on deposit rates encourage savers to channel their funds into informal financial systems or foreign assets. Generally, interest rate ceilings prevent a price-based allocation of funds (Montiel, 2011).
According to Jafarov et al. (2019), the global financial crisis of 2008-09 rekindled the debate on the role of government, prompting calls for increased regulation and supervision to strengthen the stability of the financial system. Conversely, the surge in government debt has revived debates regarding the potential role of financial repression as a second-best solution to reduce debt burdens. Reinhart et al. (2011) suggest that the large public and private debts in advanced economies, combined with the perceived risks of currency misalignments and overvaluation in emerging markets facing capital inflows, have contributed to a resurgence of financial repression. This approach typically aims to provide cheap loans to companies and governments, reducing their repayment burdens by lowering returns to savers below the market rate.
To account for the relevance of the oil sector in each country, we use oil rents, defined as the value of crude oil production at world prices minus total production costs. This calculation involves estimating the price of oil barrels and subtracting average unit extraction costs. The resulting unit rents are then multiplied by the physical quantities extracted by each country to determine the rents for oil as a share of gross domestic product (GDP). In some countries, these earnings account for a substantial share of GDP, primarily in the form of economic rents-revenues that exceed the costs of resource extraction.
Natural resources generate economic rents because they are not produced. When countries utilize these rents to support current consumption instead of investing in new capital to replace what is being depleted, they effectively borrow against their future.6 This variable is expressed as a percentage of GDP and is sourced from the World Bank's World Development Indicators (WDI).
To establish the type of ownership of oil companies, we used the Natural Resource Governance Institute (NRGI) database. According to NRGI, National Oil Companies (NOC) produce 55% of the world's oil and gas. They dominate the production landscape in some of the most oil-rich countries, including Saudi Arabia, Mexico, Venezuela, and Iran, and play a central role in the oil and gas sector. However, the NRGI dataset only covers the period from 2011 to 2017. Therefore, it was necessary to supplement this information with data from national sources to identify which countries have NOC.7
As for control variables in the model, we include a variable to account for institutional strength, using the Polity index8 as a proxy for institutional quality. According to Bhattacharyya and Hodler (2014), higher institutional strength fosters better conditions for financial development, as a greater degree of democracy enhances transparency and government accountability, thereby reducing financial repression. To account for the level of economic activity, we include gross capital formation and final consumption expenditure as percentages of GDP, which allow us to estimate the impact of demand for loanable funds. In the interest rate control model, we use the logarithm of the Consumer Price Index (CPI), positing that rising inflation incentivizes governments to limit nominal interest rates to avoid higher financing costs, reflecting the fiscal dominance of monetary policy. Many developing countries have faced double-digit inflation rates, leading monetary authorities to intervene in real interest rates through rate controls, which contributes to financial repression (Namazi and Salehi, 2010).9 Additionally, we include dummy variables for region and time trends.
As control variables, particularly for the interest rate controls model, we include oil prices, which capture a distinct dynamic compared to oil rents. According to Mansour and Nakhle (2016), the relationship between governments and companies varies with oil prices, which serve as a trigger for modifications in the upstream fiscal regime. High oil prices typically lead to increased taxes, contract renegotiations, tougher regulations, and, in extreme cases, expropriation and nationalization, as host governments seek to capture a larger share of the industry's perceived higher profitability. Reactions among oil-producing countries range from straightforward tax rate increases to the implementation of new taxes and enhanced shares for national oil companies, and even the expropriation of assets. The price level significantly shapes the bargaining power of each party at the negotiating table: when oil prices are high, governments often hold the upper hand, whereas declining prices tend to favor companies. However, the response to declining prices is generally less visible and more erratic than that to rising prices (Mansour and Nakhle, 2016). The international oil prices are sourced from the Brent crude oil spot price series.
Fiscal Dependence on Oil Revenues and Control Variables
According to our hypothesis, governments in countries with high oil rents and national oil companies have direct access to these revenues, granting them greater discretion in utilizing these resources. This situation encourages the emergence of rentier states, characterized by weak tax systems that depend heavily on oil taxes and indirect or implicit taxes across various sectors of the economy (Luong and Weinthal, 2010), including financial repression.
Governments often suppress the financial system to fund their quasi-fiscal activities. Consequently, rentier states with weak fiscal structures arise, leading to persistent fiscal deficits that drive governments to impose interest rate controls and other forms of financial repression, which, in the long run, undermine the development of the financial system.
To test this working hypothesis, it is essential to estimate the dependence of total government revenues on oil taxes. However, to the best of our knowledge, no comprehensive dataset exists that details the magnitude of oil taxes as a share of total government revenues. Instead, we found only partial information from various sources, including the World Development Indicators (WDI), the OECD, and the National Oil Companies (NOC) database.
To measure fiscal dependence, we developed a summary measure that averages oil rents and NOC transfers to governments. Oil rents are sourced from the World Bank's WDI, while NOC transfers come from the Natural Resource Governance Institute (NRGI). Both sources have limitations: the WDI lacks information on government revenues for nearly 40 % of the panel data, while the NOC transfer data only covers the period from 2011 to 2017.
The fiscal dependence index is a weighted index composed of normalized indices for two dimensions, the significance of oil revenues to government revenues and NOC transfers to the fiscal budget. To construct the index, we first normalize each country's distance relative to the maximum value observed in the database. Each component's magnitude is then converted to a scale between 0 and 1 using the following formula:

Where I(X ¡,t ) is the fiscal dependence index for each country i in year t. M and m represent the maximum and minimum values of X ¡,t across all observations, respectively. The term X ¡,t refers to the observed value of the variable for country i in year t. Finally, to construct the fiscal dependence index, we averaged the two components:

It should range from 0 (no fiscal dependence) to 1 (total dependence).
The fiscal dependence measure used in this study has limitations, particularly due to the lack of government revenue data from seven countries: Algeria, Ecuador, Hong Kong, Nigeria, Pakistan, Venezuela, and Vietnam. Notably, five of these countries have significant oil rents and national oil companies. While the absence of data from these countries may weaken the indicator, it remains sufficient to test the research hypothesis.
Methodology
This research aims to determine whether the combination of national oil companies and fiscal dependence on oil rents affects financial development. The study uses a large sample of 90 countries over a 45-year period. This analysis relies on financial indicators such as bank credit to the private sector and interest rate controls. Monetary and financial indicators exhibit inertia, meaning that variables in this sector tend to remain relatively unchanged over time (Mlachila and Ouedraogo, 2020). This inertia arises because central bank decisions depend on information about the state of the economy, along with delays in the transmission of monetary policy. From the perspective of financial institutions, factors such as asymmetric information, risk aversion, and banking regulations-particularly those related to solvency and provisioning-contribute to the persistence of financial indicators such as bank lending.
To account for the inertia in interest rate controls and bank credit to the private sector, we employ dynamic panel data analysis. This approach allows us to capture the impact of lagged endogenous variables and the unobservable fixed effects of the countries in our sample. The dynamic model estimates the effects of interest rate control and bank credit based on their lagged values and a set of control variables.

In this specification, y i,t , denotes the dependent variable for unit i in period t, representing either the level of interest rate controls (IRC) or the change in credit to the private sector. The vector X i,t-1 contains explanatory variables, including contemporaneous and lagged values. The term η i captures unobserved, time-invariant individual heterogeneity, while Є i,t denotes the idiosyncratic error term.
Endogeneity may arise from several sources. First, the individual-specific effect may be correlated with the regressors, E(η i | χ i ) ̸= 0.. Second, n is also likely to be correlated with the lagged dependent variable, E(η i | y i,t −1) ̸= 0.. Third, contemporaneous or lagged covariates may be correlated with the idiosyncratic error term, E(ϵ i,t | χ i ) ̸= 0 for for t ≤ s. Additional endogeneity concerns include unobservable variables and potential reverse causality among the right-hand side variables.
Inference issues also arise when the number of time periods T is small, leading to finite-sample bias in coefficient estimation. Conventional fixed or random effects estimators are therefore biased and inconsistent in this setting (Bun et al., 2013). As a result, it has become standard to employ Instrumental Variables (IV) methods or the Generalized Method of Moments (GMM), which yield consistent estimates when T (T, i.e., years) is finite and the cross-sectional dimension N (N, i.e., countries) is large. According to Bond (2002) and Baltagi and Baltagi (2008), GMM is appropriate when (N ≥ T), as in this study. Furthermore, Labra Lillo and Torrecillas (2018) emphasize that dynamic panel methods address individual heterogeneity and allow the use of multiple instruments to mitigate endogeneity.
Two main GMM approaches are available. The first, difference GMM (Arellano and Bond, 1991), uses lagged levels as instruments for equations in first differences. The second, system GMM (Arellano and Bover, 1995), combines the difference equations with additional moment conditions in levels, using lagged differences as instruments. The latter improves efficiency and reduces finite-sample bias (Bond, 2002). The augmented system GMM estimator of Blundell and Bond (1998) has been widely adopted, with Monte Carlo evidence supporting its performance (Roodman, 2009). Given the presence of country-specific effects and a lagged dependent variable, we adopt the system GMM estimator.10
When selecting GMM estimators to address endogeneity arising from simultaneity bias and omitted variables, it is essential to acknowledge the specific challenges inherent to dynamic panel data models. One key concern with the system GMM approach is instrument proliferation. An excessive number of instruments can lead to overfitting, weakening the Hansen test and increasing the risk of biased estimates. To mitigate over-identification, we restrict the instrument count by limiting the lag depth of the dependent variable to one (Roodman, 2009) and reducing the instrument set accordingly.
Following de Mendonça and Barcelos (2021), we ensure that the ratio of instruments to cross-sectional units remain below one. The validity of the instruments is assessed using the Hansen test for over-identifying restrictions, while the Arellano-Bond test for serial correlation ensures the absence of second-order autocorrelation in the first-differenced residuals. We also verify that the number of cross-sectional units exceeds the number of instruments to safeguard against overfitting and weak identification.
For empirical analysis, it is essential to test for the presence of unit roots in panel data. Given that our dataset spans a 45-year interval, it is important to consider the serial correlation patterns in the panel, which may include both short-memory and persistent components. These patterns can lead to inconsistencies in pooled estimators in dynamic heterogeneous panel models. The main advantage of using panel unit root tests is their significantly greater power compared to standard time-series unit root tests in finite samples (Taylor and Sarno, 1998).
Im et al. (2003) propose a testing procedure that utilizes a standardized t-bar test statistic based on the augmented Dickey-Fuller statistics averaged across groups Bornhorst and Baum (2007).11 We employ the IPS test, incorporating both a constant and a time trend in the specification to account for the inertia of the time series. An important advantage of the IPS test is its applicability to unbalanced data panels, such as our dataset, which includes a moderate number of cross-sectional groups over a long time period. Additionally, it is particularly useful for our dynamic heterogeneous panel data as it allows for heterogeneity across countries, including individual-specific effects and unique patterns of residual serial correlations.
Subsequently, we perform a marginal effects analysis to examine whether oil company ownership negatively impacts financial development, while controlling for the fiscal dependence of government revenues on oil rents. The partial effect measures the change in the conditional mean of the dependent variable associated with a change in one of the regressors. In a linear regression model, the marginal effect corresponds to the estimated slope coefficient (Cameron, 2005). Our focus is on the marginal effect of a change in ownership structure (a categorical variable) from 0 to 1 on the conditional mean of financial development, holding the other variables constant. For a dichotomous regressor, the marginal effect is the difference in adjusted predictions between the two categories-in this case, public versus private ownership of oil companies. We compute average marginal effects (AME) using a variance-covariance matrix corrected for finite-sample bias. The mean partial effect of ownership structure is expressed as:

A negative and statistically significant value of AME would indicate that public ownershif oil companies is associated with lower levels of financial development, after accounting for fiscal dependence on oil rents and other controls.
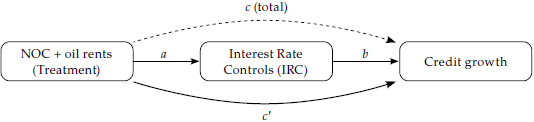
To further identify the causal impact of the proposed institutional arrangement on financial development, we conduct a mediation analysis.12 This approach decomposes the total effect of the mix of oil company (NOC) ownership and large oil rents on financial development (FD). Following Dippel et al. (2020), we separate the total effect into the indirect effect-the portion transmitted via the mediator variable, interest rate controls (IRC)- and the direct effect, which captures the impact not operating through IRC. This implies that the combined presence of NOC and large oil rents influences financial development both indirectly, through interest rate controls, and directly, via other channels.
The magnitude of the indirect effect reflects the degree to which the relationship is mediated through the relevant variables. With complete mediation, the total effect of an independent variable on a dependent variable is transmitted entirely through one or more mediator variables. In this case, the independent variable has no direct effect on the dependent variable; rather, its entire effect is indirect. In contrast, with partial mediation, an independent variable has both direct and indirect effects on a dependent variable. The direct effect is not mediated, while the indirect effect is transmitted through one or more mediator variables (Edwards and Lambert, 2007).
This path analysis will support the findings obtained from the marginal effects and verify whether the interaction between fiscal dependence and domestic ownership of firms (treatment) exerts a direct effect on financial development (outcome), as well as an indirect effect through interest rate controls. The magnitude of the indirect effect indicates the extent of mediation through the relevant mediator variables.
Sample
Jafarov et al. (2019) estimated the losses caused by interest rate controls (financial repression) on economic growth. For this purpose, they updated the database developed by Abiad et al. (2009), which included information on different dimensions of financial repression. We utilized this update to build our own database, which contains information on 90 countries on an annual basis, covering the period from 1973 to 2017.
In the database, 41 countries (46% of the sample) are either non-oil or only marginal oil producers, and most of them do not possess proven oil reserves.13 The remaining 49 countries are oil producers. Within this group, 37 nations operate through national oil companies. Among these, 18 major producers generate oil rents that equal or exceed 3% of GDP.
We hypothesize that countries with oil rents, public companies for the exploitation of hydrocarbons, and a weak tax system characterized by fiscal dependence on oil revenues negatively impact the development of their financial systems. For this reason, we focus on countries in the sample with oil revenues and national oil companies. Since fiscal dependence is not directly observable, we approximate it using the fiscal dependence index.
Model specification
To assess the impact of the described institutional arrangement on financial development, we investigate whether this environment is associated with the implementation of interest rate controls. Specifically, we explore the interaction of these variables jointly: countries with oil rents, national oil companies, and fiscal dependence on oil revenues are more likely to implement interest rate controls, resulting in their banking systems granting lower credit compared to countries that lack these characteristics. According to Jafarov et al. (2019), financial repression reduces the return on savings, leading to financial disintermediation. By weakening price signals, it distorts the allocation of investment, thereby reducing the rate of return. A ceiling on loan interest rates benefits selected borrowers at the expense of depositors, who receive lower rates on their deposits. This constitutes a quasi-fiscal operation that effectively taxes depositors while subsidizing selected borrowers.
The empirical strategy consists of a first step involving the estimation of two dynamic panel data models, with one dependent variable representing interest rate controls and the other representing the change in credit to the private sector as a share of GDP. In both models, we use the interaction of oil company ownership, oil revenues, and fiscal dependence as the main independent variables in the regression, although the control variables differ between the two models. Both estimations aim to determine whether the specified conditions favor the imposition of interest rate controls by governments, thereby endogenizing the decision to implement financial repression measures. In the second model, we examine not only the effect of the interaction on the variation in credit to the private sector, but also the impact of interest rate controls on countries' financial development. Subsequently, we perform marginal effects analysis and mediation analysis to provide further evidence of causal relationships.
To perform the dynamic panels, we first check the stationarity of the variables in the models. Credit to the private sector, which accounts for financial development, exhibits unit roots when the variable is taken in levels. However, in the first difference, we reject the null hypothesis of non-stationarity at the 1 percent level. Furthermore, we find that both the oil price level and the Consumer Price Index (CPI) are stationary. However, we were unable to apply the IPS test for the logarithm of gross capital formation, consumption expenditure, polity, oil rents, and IRC, as not all groups had sufficient observations.
Model for Interest rate controls

In this specification, the dependent variable IRC ¡,t is the level of interest rate controls in country i at time t. The model includes a lagged dependent variable IRC i,(t-1) to account for persistence over time. The key independent variable NOC i,t is a binary indicator equal to 1 if a national oil company is present, and 0 otherwise. Fiscal dependence on oil revenues is captured by the variable depf i,t , while oilrent i,t measures oil rents as a percentage of GDP. The specification includes several interaction terms, among National Oil Companies, the fiscal dependence index and oil rents. The model also controls for political regime characteristics through polity i,t , and for external price effects with the log of oil prices lnoprice i,t . The vector X i,t includes additional controls such as time trends, regional fixed effects, the difference in the logarithm of gross capital formation and final consumption expenditure (as a percentage of GDP), and the logarithm of the consumer price index (CPI). Finally, ε i,t denotes the standard error term.
This specification includes oil prices as an explanatory variable. Notably, this variable exhibits a low correlation with oil rents among major oil producers. In fact, the correlation coefficient between oil prices and oil rents as a percentage of GDP for oil-abundant countries is 0.176.
Higher oil prices encourage host governments to demand a greater share of the industry's increased profitability through taxes or contract re-negotiations (Mansour and Nakhle, 2016). This increase in tax revenues reduces the need to raise indirect taxes on the financial system by using interest rate controls. Conversely, low oil prices decrease government oil revenues, leading to greater fiscal pressures that compel governments to implement financial repression measures.
Additionally, oil rents are a long-term characteristic that influences a country's productive structure and, consequently, the development of its financial system. In this context, oil prices act as a lever that triggers governments' short-term financial needs and drives the implementation of financial repression measures.
Model for private credit as percentage of GDP
In this context, the financial motivations of governments to implement financial repression by manipulating interest rates lead to financial underdevelopment. To test this hypothesis, we employ the following model:

In this dynamic panel model, the dependent variable ΔCredit i t measures the change in domestic credit to the private sector as a percentage of GDP for country i in year t. The specification includes a lagged dependent variable, ΔCredit i,(t-1) , to capture persistence in credit dynamics. The variable NOC¡ t is a binary indicator equal to 1 if a national oil company is present, and 0 otherwise. The model incorporates oilrent i t , representing oil rents as a percentage of GDP, and depf i,t , an index capturing fiscal dependence on oil revenues. To assess the conditional relationships between these factors, the model includes two-way and three-way interaction terms among National Oil Companies, the fiscal dependence index and oil rents. The model also accounts for institutional and macroeconomic factors. Specifically, IRC i,t reflects the degree of interest rate controls, and Δlnfbk i,t captures the change in the logarithm of gross capital formation as a percentage of GDP. A time dummy, d1974, is included to control for global shocks beginning in that year. The vector X i,t includes instrumental variables such as country-specific trends, regional dummies, and the political regime indicator (polity). Finally, ε i,t denotes the standard error term.
As a second step, we apply a test to assess the marginal effect of fiscal dependence on oil revenues regarding the control of interest rates and the deepening of credit relative to GDP in countries with national oil companies. As Cameron (2005) note, the marginal effect most often measures the impact on the conditional mean of y resulting from a change in one of the regressors, X k . This marginal effect illustrates how the probability of implementing interest rate controls changes depending on whether the ownership structure is private or state-owned, while controlling fiscal dependence on oil rents.
In the third step, we apply a mediational analysis. The basic mediational framework involves a three- variable system in which an initial independent variable influences a mediational variable, which, in turn, affects an outcome variable (Baron & Kenny, 1986). In our case, we test the proposed causal mechanism in which the interaction of government revenues, dependent on high oil revenues, and the presence of national oil companies hinders financial development through interest rate controls applied to the banking system. The mediational analysis aims to determine whether the relationship between the initial variable and the outcome is due, wholly or in part, to the mediator (Krull & MacKinnon, 2001). A variable is generally accepted to lie on the causal path if it is measured after the cause and before the effect and if its inclusion in the regression reduces the size of the presumed causal variable's coefficient Baron and Kenny (1986).
Model for Interest rate controls
Table 2 presents the estimation results for the dynamic panel analysis aimed at explaining interest rate controls. This analysis is based on the lagged dependent variable, the institutional arrangement of oil companies, and incorporates oil prices and the political environment as additional exogenous variables.
Statistical tests do not invalidate the econometric method, as the null hypotheses of the Hansen and AR(2) tests are not rejected. The significance of the coefficient associated with the lagged interest rate control (IRC) underscores the inertia present in these controls, thereby justifying the use of dynamic panel data.
To assess the influence of fiscal dependence on interest rate controls in countries characterized by oil revenues and public oil companies, this analysis considers both direct impacts and various interactions, which are evaluated through regression analysis. Consequently, to determine the overall effect, it is imperative to evaluate the marginal effect of fiscal dependence in relation to interest rate controls, taking into account whether the oil companies are privately or publicly owned (Table 3). We specify separate sets of effects to be estimated for countries with National Oil Companies and those without. The average marginal effect serves as an estimator of the average impact based on the ownership status of the oil company. Marginal effect tests are conducted using the observed values of oil rents at their means.
The results indicate that countries with national oil companies tend to impose more controls on interest rates. When the IRC variable approaches zero, it reflects a situation where the tightest controls on rates are enforced. The estimated coefficient is negative and significant at the 5% level, suggesting that higher fiscal dependence correlates with the application of tighter interest rate controls.
Regarding the explanatory variables in the dynamic panel data, both political factors and oil prices are found to be positive and significant. Thus, we interpret that more democratic countries tend to implement fewer interest rate controls, while higher oil prices increase government revenues and reduce the need to seek alternative funding sources.
Model for private credit as percentage of GDP
The dynamic panel analyzes the change in credit to the private sector as a percentage of GDP, based on the lagged dependent variable and the institutional arrangement of oil companies. Independent variables include interest rate controls, the change in the logarithm of gross capital formation, and a dummy variable for the year 1974. In that year, international oil prices experienced an atypical increase (over 250% per year) due to the oil embargo imposed by Saudi Arabia, Iran, Iraq, the United Arab Emirates, Kuwait, and Qatar, which began at the end of 1973. The results are presented in Table 4.
Statistical tests validate the econometric method, as the null hypotheses of the Hansen and AR(2) tests are not rejected. The significance of the coefficient associated with lagged credit emphasizes the inertia present in this financial indicator. Regarding the explanatory variables, fewer interest rate controls have a positive effect on credit deepening, while gross capital formation and the dummy variable are also positive and significant. Once again, it is essential to apply marginal effects tests to assess changes in credit depth concerning fiscal dependence by dividing the sample based on the ownership of oil companies (Table 5).
Evidence from applying this test indicates that countries with fiscal dependence on oil revenues and national oil companies exhibit lower levels of financial development, as measured by credit deepening. The results of the marginal effects tests-both for the use of interest rate controls and for the growth of the credit share of GDP-show that fiscal dependence on oil revenues in countries with National Oil Companies is associated with a higher prevalence of interest rate regulations and slower credit growth.
Mediation analysis
The third stage of the empirical strategy involves applying mediation tests for panel data. The motivation for conducting this exercise is to disentangle the channels through which the combination of National Oil Companies (NOC) and oil rents influences financial outcomes. In particular, we seek to identify whether this interaction is systematically associated with the use of interest rate controls (IRC). Such controls may temporarily stimulate credit growth in the short run by artificially lowering borrowing costs, but over time they tend to distort market signals, constrain financial intermediation, and ultimately reduce credit expansion. Mediation analysis therefore provides a suitable framework to capture both the immediate and the longer-term effects of resource dependence and state ownership on financial development, allowing us to distinguish between direct effects and those operating through financial repression mechanisms.
We apply the approach adapted from Krull and MacKinnon (2001), which relies on estimating three equations: (1) the dependent variable, credit growth, regressed on the independent variable, defined as the interaction between NOC presence and oil rents; (2) the mediator variable, interest rate controls (IRC), regressed on the same independent variable; and (3) credit growth regressed simultaneously on both the mediator variable (IRC) and the independent variable (NOC + oil rents). In this framework, the portion of the effect of the exogenous variable that is transmitted through IRC is identified as the indirect effect, while the portion that flows directly to credit growth is the direct effect. The total effect corresponds to the sum of these two components.
A mediation analysis is conducted using a mixed-effects regression model to examine the relationship between the independent variable-the interaction between fiscal dependence and the National Oil Company-the mediator, IRC, and the dependent variable, the credit growth rate. The interaction term is not significant in Equation 1 (c path ) but is a significant predictor of interest rate controls in Equation 2 (α path ), indicating that as fiscal dependence increases, interest rate controls also increase. Additionally, the effect of the mediator IRC on credit growth is significant (b path ). This supports the mediation hypothesis, suggesting that IRC plays a crucial role in the relationship between fiscal dependence and credit growth.
In summary, while fiscal dependence does not directly affect credit, it significantly influences interest rate controls, which in turn affects the growth rate. The mediation analysis indicates that IRC accounts for around 20% of the total effect of fiscal dependence on credit. The ratio of the indirect effect to the direct effect is approximately 0.25, suggesting that the indirect effect is about 25% of the direct effect.
Discussion
Our findings reveal important policy implications for oil-rich countries. When governments decide to retain control of the oil industry, often the largest or one of the largest sectors in the economy, they typically establish a National Oil Company (NOC) and design institutional arrangements that channel oil rents to the rest of the economy. While this model enables states to capture and redistribute resource wealth, it also creates a vulnerability. When fiscal needs exceed the revenues provided by oil rents, governments often resort to financial repression measures. A prominent example is the use of interest rate controls (IRC) to direct credit toward quasi-fiscal activities.
Although such interventions may provide short-term liquidity and stimulate credit growth, they distort saving incentives and undermine the efficiency of financial intermediation. Over the long run, these distortions constrain credit expansion and weaken the financial system's ability to support sustained economic growth. Beyond the scope of this research, there are additional adverse consequences. Monetary policy becomes less effective in containing inflation, and the use of negative real interest rates can actually exacerbate inflationary pressures. Moreover, financial repression tends to encourage capital flight, as domestic returns become lower or even negative, and it discourages foreign direct investment. These mechanisms have been extensively documented in the literature, from the early analyses of McKinnon (1973) and Cole and Shaw (1974) to subsequent empirical work (Giovannini, 1985; Abiad et al., 2009; Jafarov et al., 2019). The combined effect is to reduce both domestic and external sources of finance, making it more difficult for these economies to sustain growth.
Governments should avoid financial repression as a means of financing quasi-fiscal activities. Building transparent and broad-based tax systems, supported by stabilization or sovereign wealth funds, provides a more sustainable path to fiscal stability. In this way, credit markets can remain deep, resilient, and capable of supporting long-term growth without the distortions created by financial repression. A similar pattern is highlighted by Reinhart et al. (2011), who document how financial repression has historically been employed as a tool for managing fiscal pressures and public debt, often at the expense of financial development and long-term growth. In oil-rich economies that directly manage the oil industry via a National Oil Company (NOC), the short-term benefits of financial repression are outweighed by long-term costs, namely weaker credit markets and slower investment and growth.
Conclusions
In this paper, we hypothesize that oil-producing countries that manage their oil business through national companies may experience high fiscal dependence on these revenues, which encourages them to employ various mechanisms to finance public spending through specific measures of financial repression, such as interest rate controls. This proposed arrangement acts as an underlying mechanism that weakens credit expansion in the banking system because credit is not allocated efficiently, and depositors receive lower returns than they would in the absence of interest rate restrictions.
To study this hypothesis, we used the database on interest rate controls developed by Jafarov et al. (2019). By applying dynamic panel data analysis, along with marginal and mediation effects tests, we obtained empirical evidence that countries with national oil companies and governments dependent on oil revenues are more likely to implement interest rate controls. This, in turn, inhibits private credit growth and constrains the development of the financial system.
The results obtained provide an alternative explanation for the financial curse by endogenizing the application of financial repression within the institutional framework that characterizes countries with national oil companies and a high fiscal dependence on oil revenues. National Oil Companies are often viewed as sources of revenue for the state, which limits their ability to develop the investment plans necessary to maintain their competitiveness in the international oil market.
In this context, an important economic policy implication emerges. Resource-rich countries that rely predominantly on revenues generated by oil companies have fewer incentives than their non-oil counterparts to establish a fiscal system based on direct, transparent, and broad-based taxation. Moreover, this overdependence on oil rent undermines fiscal discipline and increases vulnerability to external shocks, often compelling governments to resort to financial repression. To mitigate these risks, it is essential to develop a fiscal system less dependent on oil revenues. In particular, the creation of sovereign wealth or stabilization funds-governed by clear rules for channeling excess revenues during boom periods and transparent mechanisms for withdrawals during downturns-could help stabilize fiscal resources. Thus, by reducing revenue volatility and the temptation to interfere in financial markets, such an approach would foster greater macroeconomic stability and stimulate long-term financial and economic development.
Future research should examine how these dynamics evolve under different external and institutional conditions. The effects identified in this study may be amplified during periods of low oil prices, when more dependent countries are compelled to resort to financial repression as a substitute for lost revenues. Investigating the role of price volatility in shaping the incentives for financial repression would therefore add important insights. Another relevant dimension concerns institutional quality and regime type, since weak institutions or autocratic governments may be more prone to employ repression as a policy tool. In addition, further research could explore in greater detail how financial repression undermines the effectiveness of monetary policy, both in stabilizing inflation and in sustaining credit markets. Collectively, these extensions would deepen the understanding of how resource dependence and institutional arrangements interact to shape long-term financial development.
Finally, it is important to note that a limitation of this research is the estimation of fiscal dependence. In the case of some countries with high oil revenues, it was not possible to obtain data on public revenues, which could impact the estimates made, although it is unlikely to change the overall conclusion.