10.12804/revistas.urosario.edu.co/economia/a.15766
Articulos
Enrique Samanamud 1
Luis G. Martínez 2
Daniela N. Marcelo 3
1 Head of the Customs and Taxation Institute, SUNAT.
Master's in public finance.
Professor and researcher at the Scientific Research Institute (IDIC) of the University of Lima, Peru.
 0000-0002-3380-1504
 csamana@ulima.edu.pe.
Corresponding author.
2 Bachelor of Economics.
Professional practitioner at the Economic, Financial and Social Observatory of the University of Lima.
0009-0001-3756-5385
20170906@aloe.ulima.edu.pe
3 Faculty of Business and Economic Sciences, University of Lima, Peru
0009-0002-2897-5101
20201256@aloe.ulima.edu.pe
Received: August 12, 2025
Accepted: June 02, 2026
Para citar este artículo: Samanamud, E., Martínez, L., & Marcelo, D. (2025). Okun's Law in Peru: Asymmetric Effect over Time for Unemployment and Underemployment. Revista de Economía del Rosario, 28(2), 1-31. https://doi.org/10.12804/revistas.urosario.edu.co/economia/a.15766
Abstract
This study explores the hypothesis that economic growth, measured as the growth rate of a country's Gross Domestic Product (GDP), is associated with a reduction in unemployment. This relationship was originally proposed by Okun (1962), who introduced three alternative estimation approaches that later became collectively known as Okun's Law. The analysis is conducted using the first of these approaches and annual data for Peru from 1970 to 2023. Given Peru's high levels of underemployment and labor informality, the study extends the traditional framework by incorporating the concept of "expanded unemployment", defined as the sum of unemployment and underemployment. To account for potential nonlinearities and regime-dependent dynamics, a Markov Switching Vector Autoregressive (MSM) model is employed, in which regime changes are stochastic and determined by an unobservable latent state. The probabilistic process governing regime transitions is estimated from the data through estimated transition probabilities. In addition to output growth, the model incorporates productivity, investment, and public expenditure as explanatory variables. The results indicate that GDP growth has a stronger effect on reducing expanded unemployment than on unemployment, suggesting that economic growth facilitates the transition from underemployment to adequate employment. Furthermore, the sensitivity of unemployment to output fluctuations is found to be greater during recessions than during expansions, implying that output contractions destroy jobs more intensively than output expansions create them.
Keywords: Okun's Law; unemployment; underemployment; labor market flexibility
JEL classification: E24, J24, J31
Resumen
Este trabajo explora la idea de que el crecimiento económico, entendido como el crecimiento del PIB de un país, está relacionado con la disminución de la tasa de desempleo, hipótesis propuesta originalmente por Okun (1962) mediante tres métodos para la estimación que se conocen con el nombre de su autor como Ley de Okun. Dicha relación se analiza desde el primero de los métodos, utilizando datos anuales para Perú entre 1970 y 2023, país caracterizado por su elevado nivel de empleo, subempleo e informalidad laboral; por esta razón, se extiende el análisis usando el concepto expandido de "desempleo ampliado", entendido como la suma del desempleo y el subempleo. Para ello, se aplicó el modelo de conmutación de Markov (Markov Switching VAR) donde el cambio de régimen es estocástico y el estado es una variable latente (no observable), proceso probabilístico, que perfila un estado u otro en el sistema, basado en probabilidades de transición de los propios datos, añadiendo variables como productividad, inversión y gasto público. Los resultados identifican que el crecimiento del PBI tiene un efecto más fuerte sobre la reducción del desempleo ampliado, sugiriendo que facilita la transición del subempleo a un empleo adecuado y que la sensibilidad del desempleo a la producción es mayor durante las recesiones que durante las expansiones, lo que implica que las contracciones de la producción destruyen el empleo con mayor intensidad que las expansiones lo crean.
Palabras clave: Ley de Okun; desempleo; subempleo; flexibilidad del mercado laboral.
Clasificación JEL: E24, J24, J31
Resumo
Este estudo explora a hipótese de que o crescimento económico, medido como a taxa de crescimento do Produto Interno Bruto (PIB) de um país, está associado a uma redução do desemprego. Esta relação foi originalmente proposta por Okun (1962), que introduziu três abordagens alternativas de estimativa que mais tarde ficaram conhecidas coletivamente como a Lei de Okun. A análise é realizada utilizando a primeira destas abordagens e dados anuais relativos ao Peru, de 1970 a 2023. Tendo em conta os elevados níveis de subemprego e de informalidade laboral no Peru, o estudo alarga o quadro tradicional, incorporando o conceito de «desemprego alargado», definido como a soma do desemprego e do subemprego. Para ter em conta potenciais não-linearidades e dinâmicas dependentes do regime, é utilizado um modelo Autorregressivo Vetorial com Mudança de Markov (MSM), no qual as mudanças de regime são estocásticas e determinadas por um estado latente não observável. O processo probabilístico que rege as transições de regime é estimado a partir dos dados por meio de probabilidades de transição estimadas. Além do crescimento da produção, o modelo incorpora a produtividade, o investimento e a despesa pública como variáveis explicativas. Os resultados indicam que o crescimento do pib tem um efeito mais forte na redução do desemprego alargado do que no desemprego, sugerindo que o crescimento económico facilita a transição do subemprego para o emprego adequado. Além disso, verifica-se que a sensibilidade do desemprego às flutuações da produção é maior durante as recessões do que durante as expansões, o que implica que as contrações da produção destroem postos de trabalho de forma mais intensa do que as expansões da produção os criam.
Palavras-chave: Lei de Okun; desemprego; subemprego; flexibilidade do mercado de trabalho
Classificação JEL: E24, J24, J31
Introduction
Peruvian economy is an unusual one for a developing country in Latin America: it has strong macroeconomic fundaments, as (i) it has a relatively low debt level since 2006, of 33.0 % of its GDP in 2023, (ii) has maintained a very low inflation of 3.1 average from 2000s to 2023, and (iii) its currency, the Peruvian sol, can be considered as stable since it depreciated in only 6.5 % from 2002 to 2023 (Central Reserve Bank of Peru [BCRP], 2024).
These strong fundaments are consistent with the high economic growth that the country has experienced during the early 2000s until the pandemic, with an accumulated GDP growth of 146.0 %> from 2000 to 2019 (BCRP, 2024). Economic growth contributed to a reduction in monetary poverty, from a peak of 58.7 °% in 2004 to a low 20.2 °% in 2019. However, after the pandemic poverty has remained above this level, reaching 29.0 °% in 2023, driven by rising costs of basic goods, slower income recovery, and increase income inequality (Castellares et al., 2023).
However, the continued reduction in poverty has not translated into a continued reduction in informality. Despite the solid macroeconomic context, the labor market is not so stable, considering that, despite having a relatively low unemployment rate of 5.4 °% in 2023, the country has a high underemployment rate of 51.0 %, a very high level of labor informality at 71.0 %, and a low GDP per employed person of PPP $28,951 in the same year (National Institute of Statistics and Informatics [INEI], 2024; The World Bank, 2024).
Considering this contradictory situation between Peru's macroeconomic performance and its labor market conditions, the present study seeks to estimate the Okun's coefficient for Peru, including the concept of "expanded unemployment," defined as the sum of unemployment and underemployment, given its greater relevance in a developing economy such as Peru. For this, a two-regime Markov-Switching model was estimated for unemployment and expanded unemployment, using economic growth, productivity growth, private investment, government expenditure, a variable for "wage inflexibility," and net migration as exogenous variables, with economic growth switching in the two regimes, and applying yearly data from 1970 to 2023. This study found a historically non-significant effect of economic growth over unemployment reduction, but a high relationship during periods close to crises.
Literature Review
The idea that economic growth, understood as the growth of a country's GDP, is related to a decline in the unemployment rate was originally proposed by Okun (1962) and coined as the Okun's Law. Okun's proposed three methods for the estimation:
The first difference approach, based on the percentage variations of the output and unemployment, following the formula:

where Δut is the variation of unemployment rate and ΔYt is the variation of the output and β1 < 0.
ii. The gaps approach relates the output gap as a function of the unemployment gap in the formula:

where Yt* is the potential GDP and u* is the natural or potential rate of unemployment (NAIRU). A positive β implies that unemployment above its natural rate is associated with output falling below its potential level. Okun assumes that the potential and actual GDP are equal when the unemployment rate is 4 %.
iii. The fitted-trend and elasticity approach, which proposes that the relationship is expressed in levels (logarithms), as shown in the equation:

where Nt is the observed employment level, NF is the full employment level, P0a is the base productivity in the initial period, a is the elasticity of employment with respect to output, At is the output level, r is the trend growth rate of productivity, and t is a time trend. This specification decomposes employment into a full employment benchmark adjusted for initial productivity, a cyclical effect of current output, and a secular productivity trend.
This paper focuses on the first approach for three reasons. First, for the second approach, given that the data are annual, estimating the NAIRU for Peru would have uncertainty regarding its measurement, in addition to conceptual difficulties, since the country unemployment, while structurally low, also depends on high informality and underemployment, making it difficult to define a natural rate of unemployment. This also applies to the third approach, since it would be difficult to estimate full employment if it is unclear whether informal employment or underemployment are included in definition of "full employment." Finally, the first approach was also preferred since is the most widely used in the recent literature for Latin American economies, including studies directly comparable to this one (Porras-Arena & Martín-Román, 2023a; Garavito, 2003, 2019, 2023), facilitating comparability of results.
Despite the antiquity of Okun's work, the relationship between unemployment and output remains a relevant topic. Porras-Arena and Martín-Román (2023b) attributed the heterogeneity of the results to the choice of dependent variable—either real output or the unemployment rate—as well as to the estimation method. However, by running a meta-regression on 1213 estimators of Okun's Law, they concluded that the relationship was negative for most studies, with an average coefficient ranging between -0.30 and -1.76.
Previous literature on Peru includes the work of Samanamud (2021) and Porras-Arena and Martín-Román (2023a), both of which found small Okun's effects in comparison to other countries, namely the US and other regional economies. However, Samanamud (2021) found higher parameters concerning underemployment. Other studies focused on the Lima Metropolitan Area, include González (2002) and numerous works from Garavito (2003, 2019, 2023), which also found a low Okun's coefficient. Therefore, to the authors knowledge, this paper is the first study of the nonlinear effects of Okun's Law in Peru, focusing on the country as a whole.
Several studies have analysed the validity of Okun's Law, uncovering a variety of relationships between unemployment and product output in different contexts. Aguiar-Conraria et al. (2020) applied wavelet tools to estimate the Okun coefficient for the United States using quarterly data from 1948Q1 to 2018Q2. They observed a strengthening relationship on the cyclical component since 1965, with the Okun law becoming more significant at longer cycles compared to shorter ones. Similarly, Karlsson and Òsterholm (2020) focused on the U.S., using a time-varying Bayesian vector autoregression (TV-BVAR) model from 1948Q3 to 2019Q4. Despite their findings that the unemployment-output relationship has not been stable over time, they concluded that changes in dynamics have remained quantitatively modest.
In contrast, other studies have identified more significant variations in Okun's Law across regions. Benos and Stavrakoudis (2022), for example, used a var model to analyse the G7 countries between 1994Q1 and 2018Q2. They found asymmetrical effects, while the relationship was strong in the U.S. and France, it was way weaker in countries like Italy and Japan. Their results suggest that countries in which Okun's Law holds are better positioned to implement countercyclical policies, while nations such as Italy and Japan should focus on stabilizing the business cycle.
Region-specific studies have also highlighted the varying strength of Okun's Law under different economic conditions. Akkoyunlu (2024) examined Turkey using nearly a century's worth of data from 1923 to 2019. Contrary to the linear models traditionally applied, the study used a nonlinear autoregressive distributed lag (NARDL) model and found asymmetric effects, with unemployment responding differently to changes in output based on various structural factors such as female and youth unemployment, the large agricultural sector and high levels of informal unemployment. In the same line, Lim et al. (2021) investigated the U.S. between 1990Q2 and 2017Q3, finding that Okun's coefficient exhibited asymmetries, being more pronounced during contractions than expansions.
The long-term stability of Okun's Law has also been questioned. Donayre (2022) studied US quarterly data from 1949Q1 to 2020Q1 using a three-regime threshold regression. The finding suggests that the effectiveness of output in reducing unemployment has weakened over time, particularly in periods of lower unemployment rates.
Woo (2023) reported a similar weakening of the Okun's coefficient in Korea, where the effect of GDP growth on unemployment decreased significantly over the last decade. Similarly, Gil-Alana, Skare, and Blazevic (2020) studied 24 selected countries and concluded that unemployment and output growth rates show some degree of long memory behaviour. Their estimated gaps are quite high compared with other studies' results.
Beyond national studies, cross-country comparisons have shown that Okun's Law can vary substantially depending on labour market characteristics, economic structure, and the level of development.
Furceri et al. (2020), using panel data from 85 countries (33 developed and 55 developing) from 1978 to 2014, found that countries with high unemployment, larger shares of public employment, and lower informality, tend to exhibit a stronger Okun's coefficient. This aligns with Colombo et al. (2024), who applied an unbalanced panel to 142 countries between 1995-2015, and found that countries with lower levels of informality had higher Okun's coefficients.
Kraim et al. (2023) focused on 17 oil-producer countries from 2000 to 2019 and found that growth in the services sector had a greater impact on reducing unemployment than agriculture or manufacturing. Interestingly, oil rents seemed to diminish the effect of the sectorial Okun's Law.
Moreover, youth unemployment and education levels have emerged as important determinants in the Okun relationship. Butkus et al. (2023) studied the European Union and the UK using quarterly data from 2000 to 2020. They found that the highest sensitivity of unemployment to output changes came from the youth unemployment and individuals with lower educational attainment, while those with higher education were less affected by output fluctuations.
Panel studies focusing on groups of countries, such as the OECD, have provided additional insights. Altunöz (2024) analysed 21 OECD countries from 2007 to 2022 and found that Okun's Law held in the long term, with causality running from output to unemployment. Their analysis also showed that unemployment hysteresis, the persistence of high unemployment after economic crises, was a relevant factor in these countries. Similarly, Bod'a and Povazanová (2021) used a seemingly unrelated regression (SURE) model to analyse 21 OECD countries between 1989 and 2019, finding that Okun's Law was stronger during recessions and that the reduction in unemployment was more pronounced than its increase during expansions.
There are also studies focusing on specific labour market conditions within countries. Elhorst and Emili (2022) examined regional data from the Netherlands's 12 provinces for the period 1974-2018 and found that the output growth not only reduced unemployment within a region but also generated spillover effects that reduced unemployment in neighbouring regions, but to a smaller extent, and generates a spillover effect on reducing unemployment in other regions, although smaller. This demonstrates that Okun's Law may also have spatial dimensions, where regional interdependencies play a role.
As for European economies, Mussida and Zanin (2023) applied both the OLS and a M-robust estimation on yearly data from 1981-2021 for nine countries—Italy, Spain, Greece, France, Germany, Austria, the UK, Denmark and Norway. Their study confirmed the significance of Okun's Law, although its coefficient was unstable over time. The authors also observed asymmetries reflecting the diverse labour markets and economic conditions across these nations.
Perman and Tavera (2007) also focus on European countries and examine how the Okun's Law coefficient variance evolves within the selected economies over the time, trying to prove the presence of convergence. The empirical strategy adopted is based on rolling regression estimates using the ADL model and the SVAR model. However, in most groups, the medium-term convergence of Okun's Law coefficient is rejected.
Meanwhile, Cardenas et al. (2024) explore the presence of the Okun's Law in Spain, a country with a small and even positive output gap along with one of the highest unemployment rates in the European Union. To resolve this contradiction, in this article, the authors estimate the potential product of the Spanish economy for the period 1987Q2-2022Q4 using the Updated Okun Method. The analysis suggests that both the output gap and the cyclically adjusted balance are significantly higher than estimated by European institutions, indicating a greater fiscal space for implementing expansionary fiscal policies.
Another important dimension of Okun's Law involves its responsiveness to business cycles. Kiss et al. (2023) studied Australia, the Euro Area, the UK and the U.S. using a Bayesian var model with stochastic volatility, using data from as early as 1948Q2 to 2019Q4. They found robust evidence supporting Okun's law in all four economies, suggesting that the law holds under varying business cycle conditions. On the same line, Holmes and Silverstone (2006) employed a Markov regime-switching model to examine the U.S. 'jobless recoveries' in 1991 and 2001. They found that the Okun coefficient during recessionary periods was much higher compared to other phases of the business cycle, demonstrating the law's dependence on cyclical dynamics.
While output growth may be the main driver of unemployment dynamics, the Okun coefficient should be interpreted as a reduced-form parameter that captures not only the direct effect of output growth on unemployment, but also indirect effects operating through supply-side channels—namely, labour productivity, average hours worked, and labour force participation (Ismihan, 2016). This provides theoretical basis for extending the standard specification with variables that reflect these mechanisms.
In this sense, Ismihan (2016) states changes in unemployment can be understood as the result of the interaction between output growth and the evolution of its underlying supply-side components. Although output expansions tend to reduce unemployment, simultaneous increases in productivity, working hours, or labor force participation may partially offset this effect by raising effective labor supply. Importantly, these components evolve endogenously over the business cycle, implying that the estimated Okun coefficient reflects their joint dynamics rather than a purely demand-driven relationship. As a result, differences in their behavior across time and economies can lead to substantial variation in the magnitude and stability of the coefficient.
Consistent with this framework, the empirical specification includes real GDP as the primary demand-side driver, while productivity captures adjustments in labor efficiency. Additionally, the use of both conventional unemployment and "expanded" unemployment—defined as the sum of unemployment and underemployment following Samanamud (2021)—allows for a broader assessment of labor market slack in economies characterized by high informality. This distinction is particularly relevant in contexts where labor market adjustments occur not only through open unemployment but also through variations in underemployment.
Labor supply dynamics introduce an additional layer of complexity. The cyclical behavior of labor force participation reflects the interaction of opposing mechanisms such as the discouraged worker effect (DWE) and the added worker effect (awe), along with their expansion-phase counterparts, the encouraged worker effect (ewe) and the subtracted worker effect (SWE). Recent evidence for Latin America shows that these effects are neither stable nor symmetric over the business cycle, and may intensify beyond certain thresholds (Maridueña-Larrea & Martín-Román, 2025). When procyclical effects (DWE/EWE) dominate, labour force participation tends to move with economic activity, dampening the observed response of unemployment to output. Conversely, when countercyclical effects (AWE/SWE) prevail, labour supply may expand during downturns, amplifying unemployment responses and strengthening the Okun coefficient. These dynamics reinforce the role of labour supply as a key determinant of both the magnitude and asymmetry of Okun's Law.
Finally, additional controls are incorporated to capture complementary channels. Fixed investment and government expenditure operate through the aggregate demand channel, expanding productive capacity and labour demand. In this regard, Furceri et al. (2020) show that economies with larger public employment shares tend to exhibit stronger Okun coefficients. Wage inflexibility—proxied by deviations of the minimum wage from its technically justified level—affects labour market adjustment by discouraging formal hiring and increasing informality, a mechanism particularly relevant in the Peruvian context. Net migration is also included to account for exogenous changes in labour supply that may influence unemployment dynamics independently of the business cycle.
Stylized Facts
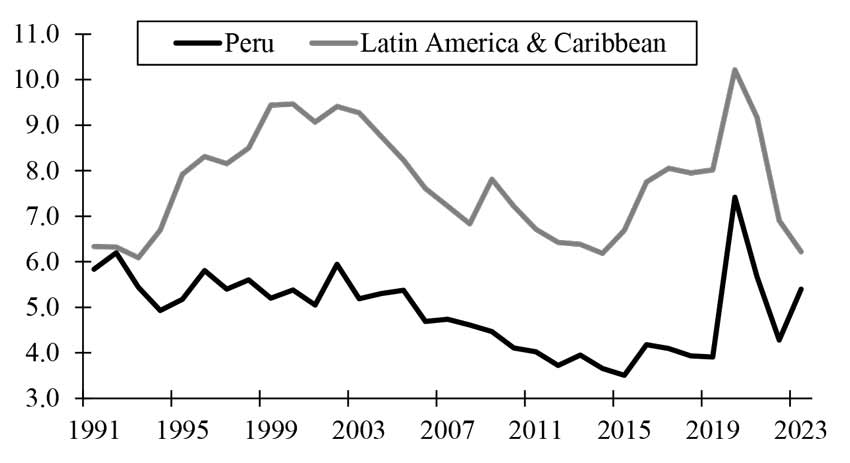
Peruvian labour market has been historically characterised by a low unemployment rate below the average for Latin America and the Caribbean and a high level of informality, the highest among the region's biggest economies and higher than the region average (International Labour Organization, 2024). These two factors are associated, due to the existence of a transition from unemployment to informality, which could be associated with the ease of finding employment in the informal sector compared to the formal one (Chacaltana et al., 2023; National Center for Strategic Planning, 2016). (View Figure 1).
Figure 1. Unemployment in Peru and Latin America and the Caribbean.
Source: Own elaboration.
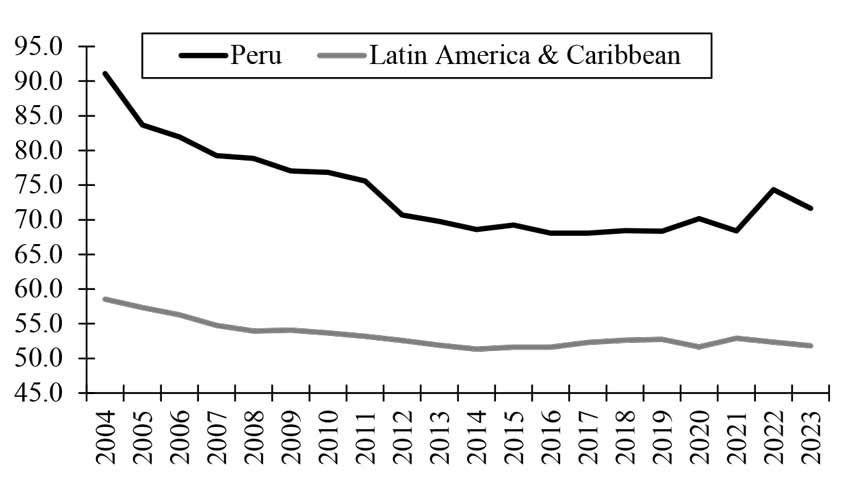
As mentioned previously, the country shows a high level of labour informality, above the regional level. Although informality declined considerably during the first decade of the 2000s due to the strong economic growth experienced by the country at the time, which generated formal-market employment, the effect of growth on reducing informality has been limited. As a result, informality has remained relatively stable since 2015, hovering around 70 % (Céspedes, 2015). (View Figure 2).
Figure 2. Labour informality in Peru and Latin America and the Caribbean
Source: Own elaboration.
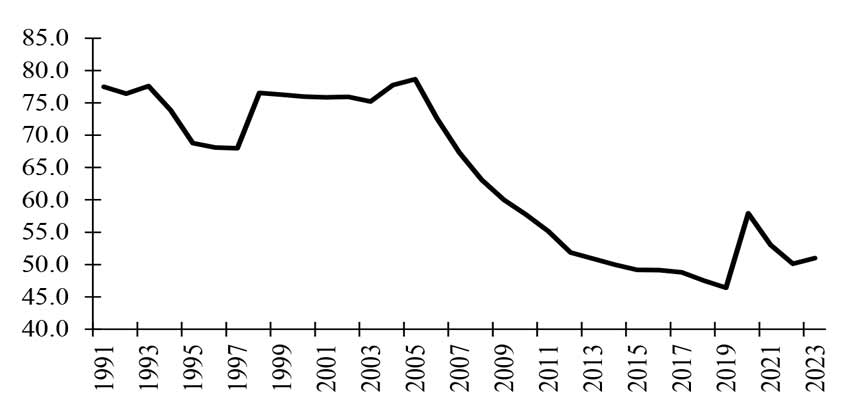
Just like informality, another key feature of the Peruvian labour market is the prevalence of underemployment, which reached 51.0 % of the labour force in 2023 as previously mentioned (INEI, 2024). Following the official methodology of the INEI (2025), underemployment takes two forms: visible underemployment, which comprises workers who are employed for fewer than 35 hours per week involuntarily and are willing to work more; and invisible underemployment, which comprises workers who are employed for 35 hours or more per week but earn less than the minimum reference income. The official underemployment figure reported by the INEI encompasses both categories. As shown in Figure 3, underemployment reduced considerably during the early 2000s, when GDP growth was at its highest, increased during the pandemic, and still has not returned to its pre-pandemic level.
Figure 3. Underemployment Rate in Peru.
Source: Own elaboration.
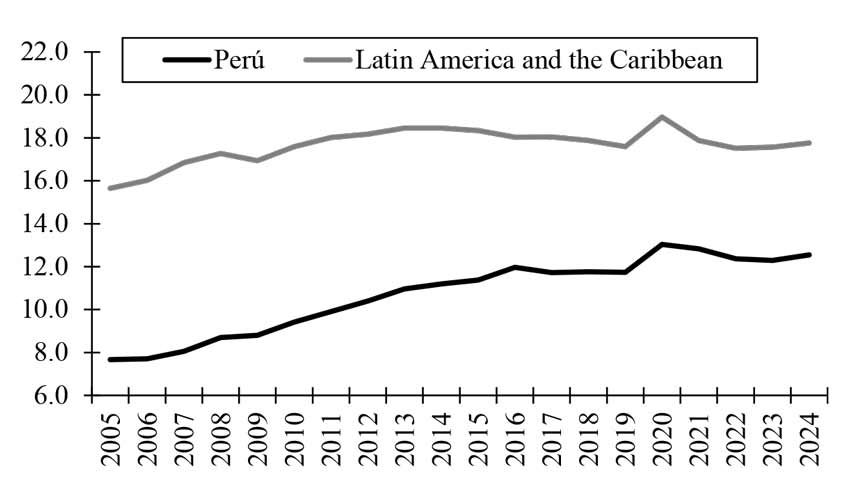
Despite increased since the early 2000s, Peru's productivity remains low. As an economy with high levels of informality and underemployment, Peru recorded a productivity level of 12.6 constant 2017 international dollars (PPP) per hour worked in 2023, below the region and the lowest among the lac-6 countries (View Figure 4).
Figure 4. Productivity in Peru and Latin America and the Caribbean.
Source: Own elaboration.
During the selected period, Peru has experienced a demographic dividend, since the proportion of people in working age (15 to 64 years old) has increased from 52.0 % of the population in 1970 to 65.7 °% in 2023 (The World Bank, 2024). This was accompanied by a reduction of the child mortality rate from 103.8 per 1,000 live births for 1970-1975 to 12.8 for 2015-2020. However, a considerable reduction in the fertility rate—from 6 children per woman to 2.3 over the same period—suggests a future scenario of population ageing. National projections for 2070 indicate that people aged 65 years and over will account for 24.0 °% of the total population (National Institute of Statistics and Informatics, 2019).
Peruvian labour market is highly concentrated on services, representing 42.6 % of total occupied population, as it includes a lot of subsectors such as transport and communications, financial services, real estate, business and rental activities, teaching activities, social services, and healthcare activities.
Extractive activities, such as agriculture, fishing, and mining, are another important pillar, accounting for 24.9 % of total employment, followed by commerce at 17.8 °%. Manufacture and construction have smaller quotes, at 8.4 % and 6.3 % respectively. It's important to mention that informality is higher in the extractive activities, at 81.2 %, although it is high on all activities, with 76.0 %% in construction, 70.6 %% in commerce, 61.4 %% in manufacturing and 59.0 % in services (National Institute of Statistics and Informatics, 2024).
Conceptual Framework
For the creation of the expanded unemployment rate, the following identities are presented, as in Samanamud (2021). First, the working-age population (woe) is formed by both the economically active population (EAP) and the economically inactive population (EIP) in the formula:
WOE = EAP + EIP —> EAP = WOE - EIP (4)
Where the EAP is composed by employed (EMP) and unemployed (UN), therefore:
EAP = EMP + UN —> UN = EAP - EMP (5)
Finally, emp is also divided in adequately employed (ADE) and underemployed (UND), so:
EMP = ADE + UND —> UND = EMP - ADE (6)
By combining (2) and (3), the following equation is obtained:
UN + UND = (EAP - EMP) + (EMP - ADE) = EAP - ADE (7)
Then, if (4) is divided by the EAP and replaced by (1), the expanded unemployment (EXU) is:

This last equation indicates that the inactive population can enter the labour market in the condition of underemployed or adequately employed, while also showing that there can be a displacement effect from adequate employment to underemployment.
Additionally, in emerging economies, the Okun's coefficient is smaller since labour market adjustments occur through mechanisms that are less prevalent in advanced economies, particularly informality and underemployment (Colombo et al., 2024; Furceri et al., 2020), justifying the inclusion of underemployment in the analysis.
Methodology
Goldfeld and Quandt (1973) present the Markov model as a framework where the dependent variable Y can be explained by two distinct regression functions, or regimens, that share the same set of explanatory variables k but differ in their parameters. Notably, the model accounts for multiple switches between regimes over time, though the researcher does not know a priori how to classify the data into these regimes. The two relationships between the dependent and explanatory variables can be expressed as follows:

Here, β1 and β2 are vectors containing the coefficients for each regime, respectively. For the existence of two distinct regimes to be supported, these vectors must differ. In both cases, the error terms u1i and u2i are assumed to have a zero mean and constant variance distribution, implying white noise characteristics (p. 1).
The Markov model is closely related to other multi-switch models, such as the λ -method, which states that the probability of 'nature' selecting regime 1 or 2 at the i-th trial is independent of the state in the previous trial. As Kuan (2002) explains, the Markov model introduces a transition matrix, which contains the probabilities of switching between the two regimes and governs the random behaviour of the state variable, represented by two parameters p00 and p11 (p. 4).

Unlike threshold models that require the researcher to select an exogenous threshold variable λt, the regime classification in the Markov switching model is probabilistic and driven by the data itself. A key implication of this framework is that regimes are not directly observed but inferred from the likelihood of the data, which introduces challenges in the interpretation of the underlying state variables.
To assess whether the Markov switching model is appropriate, two hypotheses are typically considered: (1) that the regime-dependent parameters (e.g., intercepts or slope coefficients) are identical across states, and (2) that the state variable is independent over time. Rejecting the first hypothesis provides evidence of regime-dependent behaviour, while rejecting the second supports the presence of a Markovian structure (Kuan, 2002).
In this paper, regimes are defined as distinct sets of regression parameters governing the relationship between output and unemployment, rather than as predefined trajectories of the observed variables. That is, each regime corresponds to a different response of unemployment to output fluctuations, allowing the Okun coefficient to vary across states.
The Markov switching model has been widely applied in macroeconomic analysis to identify phases of expansion and contraction without imposing arbitrary thresholds. This feature is particularly relevant in the context of Okun's Law, where the sensitivity of unemployment to output may change due to structural factors or cyclical conditions. Linear models may fail to capture these shifts, especially during periods of economic stress or recovery.
Accordingly, the estimated regimes are interpreted ex post using the smoothed probabilities, which represent the likelihood that the economy is in a given state at each point in time. This allows linking each regime to specific phases of the business cycle, rather than imposing such classification a priori.
In conclusion, the Markov switching model provides a flexible framework to capture time-varying relationships. However, it also has limitations, particularly regarding the interpretation of unobserved states and the dependence of results on data quality and sample size.
Data and Variables
For the estimation of the two models, yearly data by Perú from 1970 to 2023 was selected. Unemployment and "expanded" unemployment were used respectively as dependent variables, the latter being the sum of the unemployment and underemployment as in Samanamud (2021). Five independent variables were applied for the regression, namely the real GDP, the productivity, the wage inflexibility, the real government expenditure, the fixed investment, and the net migration, all variables in first differences.
The exact measures and data sources are presented in Table 1. Productivity growth was estimated via the Solow residual (1957), also known as total factor productivity, where the variation in productivity is estimated as:

Where Kt is the stock of capital, Lt is the labour and a is the parameter that represents the participation of capital on output. This study considers the value of the a parameter at 0.22, in concordance with It Céspedes et al. (2014). Also, Kt = It - 1 + (1 - δ)Kt - 1, K0 = αY0, where is the investment and δ is the capital depreciation rate. In this study, the depreciation rate is assumed to be 7 %.
The wage inflexibility is the arithmetical difference of the average yearly wage variation and the "theoretical" variation of the minimum wage, understood as the sum of core inflation and the variation of productivity, as in Saavedra and de la Flor (2018), where this rise responds to the technical criteria that should be followed by policymakers. However, due to limitations on yearly core inflation data, headline inflation was used instead, resulting in the equation:

Where ∆Wt is the "theoretical" variation of the minimum wage, Ant is the inflation rate and Δπ t is the variation of productivity. The final wage flexibility is then the difference between the rise of the minimum wage applied by policymakers and the rise that should have been.
Table 1. Data and Sources
Variables |
Source |
Unemployment (% of labour force) |
Multiple1 |
Underemployment (% of labour force) |
Multiple |
Real GDP growth (real % variation) |
BCRP |
Productivity growth |
Own estimations with BCRP data |
Wage inflexibility |
Own estimations with BCRP and INEI data |
Government expenditure growth (real % variation) |
BCRP |
Fixed investment growth (real % variation) |
BCRP |
Net migration |
World Bank |
Source: Own elaboration.
The correlation between variables is presented on Table 2, where a relatively high correlation is found between the GDP growth and both the unemployment and expanded unemployment rate as expected.
Table 2. Correlation between Variables
Variable |
varTD |
varTDA |
varGDP |
varA |
varG |
varINV |
INFLEX |
varMIG |
varTD |
1.0000 |
0.6777 |
-0.6045 |
-0.0949 |
-0.3585 |
-0.5528 |
-0.0261 |
0.0216 |
varTDA |
0.6777 |
1.0000 |
-0.7011 |
-0.3484 |
-0.3132 |
-0.5717 |
-0.1404 |
-0.0337 |
varGDP |
-0.6045 |
-0.7011 |
1.0000 |
0.6748 |
0.5256 |
0.8185 |
0.3583 |
0.0850 |
varA |
-0.0949 |
-0.3484 |
0.6748 |
1.0000 |
0.5251 |
0.5175 |
0.266 |
0.0744 |
varG |
-0.3585 |
-0.3132 |
0.5256 |
0.5251 |
1.0000 |
0.5582 |
0.1806 |
0.0215 |
varINV |
-0.5528 |
-0.5717 |
0.8185 |
0.5175 |
0.5582 |
1.0000 |
0.1167 |
0.0419 |
INFLEX |
-0.0261 |
-0.1404 |
0.3583 |
0.266 |
0.1806 |
0.1167 |
1.0000 |
-0.0038 |
varMIG |
0.0216 |
-0.0337 |
0.085 |
0.0744 |
0.0215 |
0.0419 |
-0.0038 |
1.0000 |
Source: Own elaboration.
Results
Before presenting the estimation results, it is useful to interpret the nature of the identified regimes. Based on the smoothed probabilities derived from the Markov switching model, Regime 1 is primarily associated with periods of economic contraction or heightened macroeconomic stress, while Regime 2 corresponds to more stable or expansionary phases. This classification is not imposed a priori but inferred from the data through the estimated transition probabilities.
The results are separated according to the dependent variable, and then in their respective thresholds. For unemployment, Table 3 and Table 4 presents the estimation results for the first and second regimes respectively.
In Regime 1, GDP exhibits a strong and statistically significant effect on unemployment reduction: a 1 % increase in output reduces unemployment by 25.32 basis points (bp), a higher coefficient than in previous literature for the country (González, 2002; Garavito, 2003, 2019, 2023; Samanamud, 2021; Porras-Arena & Martín-Román, 2023a). In contrast, in Regime 2 the effect of GDP is smaller and not statistically significant (4.63 bp), consistent with estimates such as those of Samanamud (2021), who found values between 5.80 and 7.20 bp during periods of economic growth. This asymmetry suggests that the sensitivity of unemployment to output is stronger during downturns than during expansions, implying that output contractions destroy employment more intensively than expansions create it.
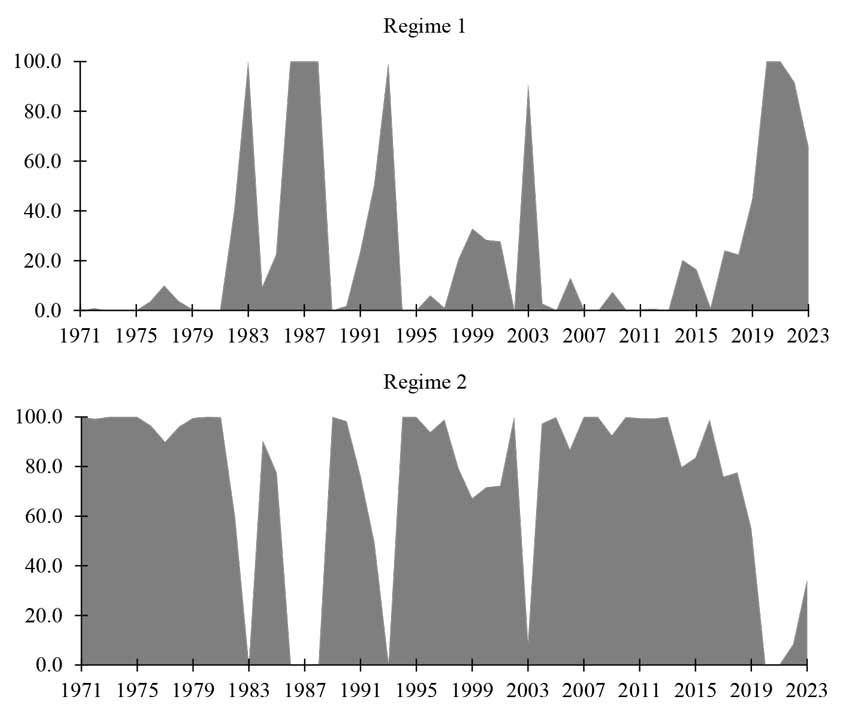
For a better analysis, the transition between regimes is portrayed on Table 4, showing that most periods had higher probabilities of being in the second regime, meaning that historically GDP growth has not affected unemployment reduction. Surprisingly, the periods within the first regime mostly correspond to crises periods or years close to crises. This may suggest that, although GDP growth does not have a significative impact on reducing unemployment, declines in GDP have a significant effect on increasing unemployment.
The historically non-significant impact of GDP on unemployment is related to the previously mentioned high level of informality in the country. Notably, the sectors that experienced the greatest growth between 1970 to 2023—the mining sector and the electricity and water subsector (the latter being part of the broader services sector)—are also among those with the highest levels of formal employment, which accounts for 62.0 % of employment in mining and 54.0 %% in the services sector, making them the only sectors in which formal employment exceeds informal employment (INEI, 2023).
Productivity has a short-term positive effect on unemployment, with an increase of 1 % reducing unemployment by 8.75 bp, as it's associated with a substitution from labour to capital, therefore reducing its demand, considering that Peru is a labour-intensive economy as mentioned in Céspedes et al. (2014). Surprisingly, government expenditure has a larger coefficient than investment, with increases of 2.05 and 0.76 bp, respectively for a 1 % increase in each variable, although the latter is more significant.
On the other hand, neither wage flexibility nor net migration influences unemployment. For wage inflexibility, this indicates that the rigidity caused by the minimum wage hasn't caused an increase of unemployment, although this result would be better complimented by the effect of wage inflexibility over expanded unemployment.
Table 3. First Regime for Unemployment
First regime |
Estimate |
Std. Error |
t value |
Pr(>|t|) |
Constant |
0.3716 |
0.0176 |
21.1136 |
< 2.2e-16 *** |
varGDP |
-0.2532 |
0.0314 |
-8.0637 |
6.661e-16 *** |
varA |
0.0875 |
0.0067 |
13.0597 |
< 2.2e-16 *** |
varG |
-0.0205 |
0.0080 |
-2.5625 |
0.01039 * |
varINV |
-0.0076 |
0.0001 |
-76.0000 |
< 2.2e-16 *** |
INFLEX |
0.0000 |
0.0000 |
Nan |
Nan |
varMIG |
0.0000 |
0.0588 |
0.0000 |
1.00000 |
varTD_1 |
0.2576 |
0.0240 |
10.7333 |
< 2.2e-16 *** |
Note: *** and *indicates a significance of 0.1 %, and 5 % respectively
Residual standard error: 0.3994116
Multiple R-squared: 0.5203
Source: Own elaboration.
Table 4. Second Regime for Unemployment
Second regime |
Estimate |
Std. Error |
t value |
Pr(>|t|) |
Constant |
0.3716 |
0.0176 |
21.1136 |
< 2e-16 *** |
varGDP |
-0.0463 |
0.0314 |
-1.4745 |
0.1404 |
varA |
0.0875 |
0.0067 |
13.0597 |
< 2e-16 *** |
varG |
-0.0205 |
0.0080 |
-2.5625 |
0.01039 * |
varINV |
-0.0076 |
0.0001 |
-76.0000 |
< 2e-16 *** |
INFLEX |
0.0000 |
0.0000 |
Nan |
Nan |
varMIG |
0.0000 |
0.0588 |
0.0000 |
1.0000 |
varTD_1 |
0.2576 |
0.0240 |
10.7333 |
< 2e-16 *** |
Note: *** and * indicates a significance of 0.1 % and 5 % respectively
Residual standard error: 0.3994116
Multiple R-squared: 0.9288
Source: Own elaboration.
For net migration, historically more people have moved out of the country than moved in, even during the decade of 2003-2013, the period of highest average GDP growth without high inflation in the history of the country. Therefore, this could explain why migration doesn't seem to have an effect over unemployment.
Finally, this could be because during the early 2000's the country experienced its highest consecutive economic growth, slowing down since 2014, falling into a recession at the 2020 pandemic, therefore the probability of being in the second regime has lowered since then.
Table 5. Transition Probabilities for Unemployment Regimes
Transition probabilities |
Regime 1 |
Regime 2 |
Regime 1 |
0.5363 |
0.1513 |
Regime 2 |
0.4637 |
0.8487 |
Source: Own elaboration.
The results for expanded unemployment are shown in Table 6 for the first regime and in Table 7 for the second one. For both regimes, GDP has a negative effect over expanded unemployment, higher than over simple unemployment, as an 1 % increase causes a respective reduction of expanded unemployment in 67.25 and 193.01 bp.
This means that economic growth is more effective at reducing the expanded unemployment than the unemployment, as not only does it create new jobs, but also creates better labour conditions for existing jobs, allowing underemployed individuals to migrate into adequate employment. Productivity, again, has a positive coefficient, increasing both unemployment and underemployment in 22.30 bp due to labour substitution as explained before.
Government expenditure is non-significant this time, as jobs at the public sector are non at underemployment conditions, and since government programs are more focused on unemployment reduction than on underemployment, combined with the fact that government jobs are, at least theoretically, under adequate employment conditions, so there's not a migration from underemployment in the government to adequate conditions. On the other hand, investment is still significant however, with a higher negative coefficient of 1.80 bp, so it is effective at reducing both unemployment and underemployment.
Table 6. First Regime for Expanded Unemployment
First regime |
Estimate |
Std. Error |
t value |
Pr(>|t|) |
Constant |
2.1411 |
0.0962 |
22.2568 |
< 2.2e-16 *** |
varGDP |
-1.9301 |
0.1415 |
-13.6403 |
< 2.2e-16 *** |
varA |
0.2230 |
0.0416 |
5.3606 |
8.295e-08 *** |
varG |
0.0174 |
0.0489 |
0.3558 |
0.72199 |
varINV |
-0.0180 |
0.0005 |
-36.0000 |
< 2.2e-16 *** |
INFLEX |
0.0024 |
0.0001 |
24.0000 |
< 2.2e-16 *** |
varMIG |
0.0000 |
0.0754 |
0.0000 |
1.000000 |
varTDA_1 |
0.3921 |
0.1960 |
2.0005 |
0.04545 * |
Note:***, ** and * indicates a significance of 0.1%, 1% and 5% respectively
Residual standard error: 2.521562
Multiple R-squared: 0.6252
Source: Own elaboration.
Table 7. Second Regime for Expanded Unemployment
Second regime |
Estimate |
Std. Error |
t value |
Pr(>|t|) |
Constant |
2.1411 |
0.0962 |
22.2568 |
< 2.2e-16 *** |
varGDP |
-0.6725 |
0.1415 |
-4.7527 |
2.007e-06 *** |
varA |
0.2230 |
0.0416 |
5.3606 |
8.295e-08 *** |
varG |
0.0174 |
0.0489 |
0.3558 |
0.72199 |
varINV |
-0.0180 |
0.0005 |
-36.0000 |
< 2.2e-16 *** |
INFLEX |
0.0024 |
0.0001 |
24.0000 |
< 2.2e-16 *** |
varMIG |
0.0000 |
0.0754 |
0.0000 |
1.000000 |
varTDA_1 |
0.3921 |
0.1960 |
2.0005 |
0.04545 * |
Note: ***, ** and * indicates a significance of 0.1%, 1% and 5% respectively
Residual standard error: 2.521562
Multiple R-squared: 0.9345
Source: Own elaboration.
Unlike the previous estimation, wage inflexibility has a significant effect over expanded employment, although the coefficient is very small at 0.24 bp. This expresses that minimum wage is one factor that explains underemployment, or more specifically informality in Peru, but it is not the main cause of it. Finally, net migration, once again, has no effect for the whole country.
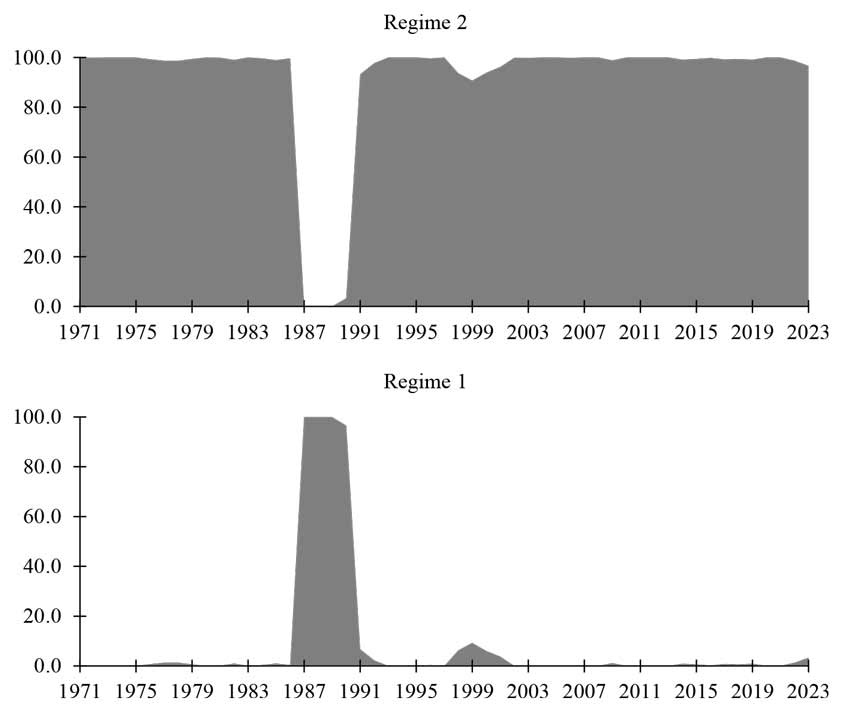
The probability between regimes can be seen in Figure 5, where most of the time the probability for the second regime has been higher. However, the first regime had a larger probability for a brief period between 1985 and 1990. This could be associated with a sudden reduction of underemployment during 1987 and 1988, which could be due to a sudden high economic growth during 1986 and 1987.
However, this lower level of underemployment was short, since it returned to its previous level after that year, as shown in figure. This was also associated with the subsequent negative economic growth in 1988, 1989, and 1990.
Figure 5. Change between Regimes for Unemployment
Source: Own elaboration.
Table 8. Transition Probabilities for Expanded Unemployment Regimes
Transition probabilities |
Regime 1 |
Regime 2 |
Regime 1 |
0.9743 |
0.2786 |
Regime 2 |
0.0258 |
0.7214 |
Source: Own elaboration.
Figure 6. Change between Regimes for Expanded Unemployment
Source: Own elaboration.
Conclusions
This paper estimates the Okun's Law for Peru with the first Okun model, including the relationship with expanded unemployment, understood as the sum of unemployment and underemployment, via a Markov-Switching model. The results show that GDP growth had a small but non-significant effect on reducing unemployment, although it had a significant effect on reducing expanded unemployment. On the other hand, a contraction in GDP had a significant effect on unemployment growth.
This could be interpreted, as economic growth permitting underemployed workers to migrate to more adequate employment conditions, either by the creation of new suitable jobs or by the firm improving the existing positions to compete with the new ones, with economic contraction causing an increase of unemployment.
However, productivity growth has opposite effects on both dependent variables, which may be related to the substitution of labour with capital. This substitution can increase firm productivity, but at the cost of reducing the demand for non-specialized labour. The investment impacts positively on unemployment and expanded unemployment reduction, following the same causes as GDP growth, although in smaller proportions.
Government expenditure affects unemployment primarily through the aggregate demand channel, as public programmes are typically oriented towards job creation under relatively stable employment conditions, limiting transitions from underemployment to adequate employment. In contrast, wage inflexibility does not appear to significantly affect conventional unemployment but exhibits a small effect on expanded unemployment. This provides evidence that minimum wage rigidity in Peru contributes to underemployment dynamics, although it is not the main driver. Finally, net migration shows no significant effect on either measure of unemployment, which is consistent with Peru's historically negative migration balance.
A key limitation of this study is the measurement of labour costs, which only includes wage components while excluding non-wage costs such as social security contributions, pensions, healthcare, and taxes. Additionally, the frequency and size of the dataset (53 annual observations) restrict the implementation of more demanding econometric frameworks, such as threshold vector autoregressive (TVAR) models, which explicitly capture the bidirectional relationship between output and unemployment.
Nonetheless, recent contributions suggest that nonlinear dynamics can still be analysed with relatively short time series. Maridueña-Larrea and Martín-Román (2025) employ threshold regression models, both endogenous and exogenous, to study asymmetries in labour force participation, showing that such approaches can be reliably estimated with samples of around 50 observations. Complementary evidence for Latin American economies also highlights the usefulness of cointegration-based methods in similarly sized datasets. From a methodological perspective, this aligns with the literature on small-sample properties of time series models, which shows that appropriate corrections can improve inference even in limited samples (Johansen, 2002). Therefore, although data constraints limit the use of certain methodologies in this study, they do not fully preclude the analysis of nonlinear or asymmetric relationships.
Future research could extend this framework by incorporating alternative measures of labour costs, including non-wage components, to better assess their role in both unemployment and underemployment dynamics. It would also be useful to explore alternative constructions of the "theoretical" minimum wage based on different measures of productivity growth, in order to reassess the impact of wage inflexibility. If higher-frequency data become available, more demanding approaches such as TVAR models could be implemented to explicitly account for the bidirectional nature of Okun's Law.
Acknowledgments
We also extend our sincere gratitude to the supportive research environment provided by the University of Lima, which was essential for the completion of this work. We also extend our sincere gratitude to the editorial team and the anonymous referees of the Revista de Economía del Rosario. Their rigorous feedback and valuable suggestions were instrumental in strengthening the quality and clarity of this paper. The authors are solely responsible for any remaining errors or omissions.
Conflicts of interest
The authors declare that there are no conflicts of interest regarding the research, authorship, and/or publication of this article.
Notes
1 Data of unemployment and underemployment from 2011 and forward was obtained from the inei. Data from previous years were proportioned by Samanamud (2021) from multiple sources including the inei, the Ministry of Labour and Employment Promotion, Central Reserve Bank of Peru and other independent authors.
References
Aguiar-Conraria, L., Martins, M. M. F., & Soares, M. J. (2020). Okun's Law across time and frequencies. Journal of Economic Dynamics and Control, 116, 103897. https://doi.org/10.1016/j.jedc.2020.103897
Akkoyunlu, §. (2024). Testing Okun's Law for Turkey (1923-2019). Studies in Economics and Econometrics, 48(2). https://doi.org/10.1080/03796205.2024.2329876
Altunöz, U. (2024). In the Context of Okun Law, the Relationship Between Real Output and Unemployment Rate in OECD: A Panel Error Correction and Panel ARDL Approaches. Ekonomika, 103(1), 6-24. https://doi.org/10.15388/Ekon.2024.103.1.1
Benos, N., & Stavrakoudis, A. (2022). Okun's law: Copula-based evidence from G7 countries. The Quarterly Review of Economics and Finance, 84, 478-491. https://doi.org/10.1016/j.qref.2020.10.004
Bod'a, M., & Povazanová, M. (2021). Output-unemployment asymmetry in Okun coefficients for OECD countries. Economic Analysis and Policy, 69, 307-323. https://doi.org/10.1016/j.eap.2020.12.004
Butkus, M., Dargenyte-Kacileviciene, L., Matuzeviciute, K., Rupliene, D., & Seputiene, J. (2023). The role of labor market regulations on the sensitivity of unemployment to economic growth. Eurasian Economic Review, 13, 373-427. https://doi.org/10.1007/s40822-023-00235-x
Cardenas, L., Ruiz, J., & Villanueva. P. (2024). Potential Output and Cyclically Adjusted Balance: An Application of the Updated Okun Method to Spain (1987-2022). Review of Political Economy, 1-21. https://doi.org/10.1080/09538259.2024.2324860
Castellares, R., Castillo, L. E., & Camacho, D. (2023). Pobreza monetaria, crecimiento económico y empleo en el Perú después de la pandemia de COVID-19. Revista Moneda, 196, 39-46. https://www.bcrp.gob.pe/docs/Publicaciones/Revista-Moneda/moneda-196/moneda-196-06.pdf
Banco Central de Reserva del Perú. (2024). Series estadísticas. BCRP Data. https://estadisticas.bcrp.gob.pe/estadisticas/series/
Céspedes, N. (2015). Crecer no es suficiente para reducir la informalidad (Working Paper No. 2015-005). Banco Central de Reserva del Perú. https://www.bcrp.gob.pe/docs/Publicaciones/Documentos-de-Trabajo/2015/documento-de-trabajo-05-2015.pdf
Céspedes, N., Aquije, M. E., Sánchez, A., & Vera-Tudela, R. (2014). Productividad sectorial en el Perú: un análisis a nivel de firmas. Revista Estudios Económicos, 28, 9-26. https://www.bcrp.gob.pe/docs/Publicaciones/ Revista-Estudios-Economicos/28/ree-28-cespedes-aquije-sanchez-veratudela.pdf
Chacaltana, J., Pérez, J., & Mora, C. (2023). Resilience or need? COVID-19, informality and the probability of being employed (Research Paper No. 17). International Labour Organization. https://www.ilo.org/publications/resilience-or-need-covid-19-informality-and-probability-being-employed
Colombo, E., Furceri, D., Pizzuto, P., & Tirelli, P. (2024). Public expenditure multipliers and informality. European Economic Review, 164, 104703. https://doi.org/10.1016/j.euroecorev.2024.104703
Donayre, L. (2022). On the behaviour of Okun's law across business cycles. Economic Modelling, 112, 105858. https://doi.org/10.1016/j.econmod.2022.105858
Elhorst, J. P., & Emili, S. (2022). A spatial econometric multivariate model of Okun's law. Regional Science and Urban Economics, 93, 103756. https://doi.org/10.1016/j.regsciurbeco.2021.103756
Furceri, D., Jalles, J. T., & Loungani, P. (2020). On the determinants of the Okun's Law: new evidence from time-varying estimates. Comparative Economic Studies, 62, 661-700. https://doi.org/10.1057/s41294-019-00111-1
Garavito, C. (2003). La ley de Okun en el Perú: 1970-2000. Economía, 26(51-52), 157-196. https://doi.org/10.18800/economia.200301.006
Garavito, C. (2019). La ley de Okun en el Perú: Lima Metropolitana 1971 - 2016 (Working Paper No. 479). Pontificia Universidad Católica del Perú. https://doi.org/10.18800/2079-8474.0479
Garavito, C. (2023). Ley de Okun en Lima Metropolitana 1970 - 2021 (Working Paper No. 519). Pontificia Universidad Católica del Perú. http://doi.org/10.18800/2079-8474.0519
Gil-Alana, L. A., Skare, M., & Buric, S. B. (2019). Testing Okun's law. Theoretical and empirical considerations using fractional integration. Applied Economics, 52(5), 459-474. https://doi.org/10.1080/00036846.2019.1646407
Goldfeld, S. M., & Quandt, R. E. (1973). A Markov model for switching regressions. Journal of Econometrics, 1(1), 3-15. https://doi.org/10.1016/0304-4076(73)90002-X
González, J. A. (2002). Labor market flexibility in thirteen Latin American countries and the United States: revisiting and expanding Okun coefficients (Working Paper No. 136). Stanford University. https://kingcenter.stanford.edu/sites/g/files/sbiybj16611/files/media/file/136wp_0.pdf
Holmes, M., & Silverstone, B. (2006). Okun's law, asymmetries and jobless recoveries in the United States: A Markov-switching approach. Economic Letters, 92, 293-299. https://doi.org/10.1016/j.econlet.2006.03.006
International Labour Organization. (2024). ILOSTAT. https://ilostat.ilo.org/
Ismihan, M. (2016). A useful framework for linking labor and goods markets: Okun's law and its stability revisited. Review of Keynesian Economics, 4(2), 175-192. https://doi.org/10.4337/roke.2016.02.03
Johansen, S. (2002). A small sample correction for tests of hypotheses on the cointegrating vectors. Journal of Econometrics, 111(2). https://doi.org/10.1016/S0304-4076(02)00104-5
Karlsson, S., & Òsterholm, P. (2020). A hybrid time-varying parameter Bayesian VAR analysis of Okun's law in the United States. Economics Letters, 197, 109622. https://doi.org/10.1016/j.econlet.2020.109622
Kiss, T., Nguyen, H., & Òsterholm, P. (2023). Modelling Okun's law: does non-Gaussianity matter? Empirical Economics, 64, 2183-2213. https://doi.org/10.1007/s00181-022-02309-2
Kraim, M., Sarmidi, T., Faizah, F., & Khalid, N. (2023). A sectoral specification of Okun's law in oil-producing countries: evidence from panel ARDL model. Economic Change and Restructuring, 56(4), 2385-2404. https://doi.org/10.1007/s10644-023-09518-4
Kuan, C.-M. (2002). Lecture on The Markov Switching Model. Institute of Economics Academia Sinica. Institute of Economics, Academia Sinica. https://homepage.ntu.edu.tw/~ckuan/pdf/Lec-Markov_note_spring%202010.pdf
Lim, G. C., Dixon, R., & van Ours, J. C. (2021). Beyond Okun's law: output growth and labor market flows. Empirical Economics, 60, 1387-1409. https://doi.org/10.1007/s00181-019-01794-2
Maridueña-Larrea, Á., & Martín-Román, Á. (2024). The unemployment invariance hypothesis and the implications of added and discouraged worker effects in Latin America. Latin American Economic Review, 33. https://doi.org/10.60758/laer.v33i.213
Maridueña-Larrea, Á., & Martín-Román, Á. (2025). Female Labor Supply in Latin America and the Business Cycle: Instability and Asymmetry1. Review of Development Economics, 29(4), 2505-2533. https://doi.org/10.1111/RODE.13231
Mussida, C., & Zanin, L. (2023). Asymmetry and (in-)stability of Okun's coefficients in nine European countries. The Journal of Economic Asymmetries, 28, e00313. https://doi.org/10.1016/j.jeca.2023.e00313
National Center for Strategic Planning (CEPLAN). (2016). Economía informal en Perú: situación actual y perspectivas (Avance de Investigación No. 8). CEPLAN. https://www.ceplan.gob.pe/documentos_/economia-informal-en-peru/
National Institute of Statistics and Informatics. (2019). Perú: Estimaciones y Proyecciones de la Población Nacional, 1950-2070. Instituto Nacional de Estadística e Informática. https://www.inei.gob.pe/media/MenuRecursivo/ publicaciones_digitales/Est/Lib1665/index.html
National Institute of Statistics and Informatics. (2023). Producción y empleo informal en el Perú - cuenta satélite de la economía informal 2022. Instituto Nacional de Estadística e Informática. https://cdn.www.gob.pe/uploads/document/file/5634048/4990510-produccion-y-empleo-informal-en-el-peru-cuenta-satelite-de-la-economia-informal-2022%282%29.pdf
National Institute of Statistics and Informatics. (2024). Compendio estadístico. Perú 2023. Instituto Nacional de Estadística e Informática. https://www.inei.gob.pe/media/MenuRecursivo/publicaciones_digitales/Est/Compendio2023/COMPENDIO2023.html
National Institute of Statistics and Informatics. (2025). Perú: indicadores del mercado laboral a nivel departamental, 2022-2024. Instituto Nacional de Estadística e Informática. https://cdn.www.gob.pe/uploads/document/file/8393806/6978987-peru-indicadores-del-mercado-laboral-a-nivel-departamental-2022-2024%282%29.pdf?v=1756480594
Okun, A. M. (1962). Potential GNP: Its Measurement and Significance. In Proceedings of the Business and Economic Statistics Section (pp. 98-104). American Statistical Association.
Perman, R., & Tavera, C. (2007) Testing for convergence of the Okun's Law coefficient in Europe. Empirica, 34, 45-61. https://doi.org/10.1007/s10663-006-9025-9
Porras-Arena, M. S., & Martín-Román, A. L. (2023a). The correlation between unemployment and economic growth in Latin America - Okun's law estimates by country. International Labour Review, 162(2), 171-198. https://doi.org/10.1111/ilr.12398
Porras-Arena, M. S., & Martín-Román, A. L. (2023b). The heterogeneity of Okun's law: A metaregression analysis. Economic Modelling, 128, 106490. https://doi.org/10.1016/j.econmod.2023.106490
Saavedra, J. C., & de la Flor, L. (2018). El reto de mejorar la política de salarios mínimos en el Perú. Moneda, 175, 42-47. https://www.bcrp.gob.pe/docs/Publicaciones/Revista-Moneda/moneda-175/moneda-175-07.pdf
Samanamud, E. (2021). Una revisión para el Perú de la relación entre el desempleo, el subempleo y la producción. Revista Finanzas y Política Económica, 13(2), 473-511. https://doi.org/10.14718/revfinanzpolitecon.v13.n2.2021.8
Solow, R. M. (1957). Technical change and the aggregate production function. The Review of Economics and Statistics, 39(3), 312-320. https://doi.org/10.2307/1926047
The World Bank. (2024). World Bank open data. The World Bank. https://data.worldbank.org/
Woo, J. (2023). Revisiting Okun's law in South Korea: Asymmetries, crises, and structural changes. The Journal of Economic Asymmetries, 27, e00292. https://doi.org/10.1016/j.jeca.2023.e00292