Introduction
Compared to other countries with similar landmass and populations, Colombia exhibits a stunning array of cultural and geographic variations (Hudson & Library of Congress, 2010). This diversity likely translates into regional economies with differentiated economic structures. As a result, these economies may exhibit varying responses to economic shocks rather than a uniform national pattern.
Despite existing literature on identifying regional clusters in Colombia, these studies remain inconclusive. This is likely due to the variation in methodologies, geographic units of analysis, and data employed across the studies. Besides, a significant portion of research on the behavior of regional economies in Colombia lacks a proper methodology for cluster identification. These studies often rely on traditional definitions of regions based on shared geographical characteristics, which can introduce selection bias into the results by failing to account for economic factors during the regional clustering process. Furthermore, research in Colombia that simultaneously focuses on the endogenous characterization of regional clusters and the behavior of the regional business economic cycle is scarce. This is despite the significant development of regional business cycle research in recent decades across the globe, with the irruption of supranational entities such as the European Union, or in some cases, in countries where their economy is approached as a set of interconnected regional economies, as in the case of the United States (Hamilton & Owyang, 2012), and the United Kingdom (Fingleton et al., 2012).
This study aims to comprehensively analyze Colombian regions' economic cycles, specifically focusing on cities and metropolitan areas. According to projections, in 2024, these areas are home to slightly more than half (50.35 %) of the country's population (DANE, 2023b). The importance of urban studies in Colombia stems from the establishment in 2012 of the National Planning Department's Cities Mission, as outlined in document Conpes 3819. This document established the institutional foundation for analyzing the development of Colombia's cities (CONPES, 2014).1 It also projects that by 2050, urban centers will house 86% of the Colombian population, solidifying their position as the country's economic growth engine.
Unlike previous research, it takes a novel approach by first endogenously identifying clusters of urban entities. This clustering is based on analyzing changes in employment growth rates (a key dependent variable of the economic cycle) alongside other measurable characteristics of each city and M.A. To our knowledge, this study is the first to allow for the possibility that regions may belong to multiple clusters. This approach provides a more accurate representation of economic complexity and the interconnectedness between these units of analysis. Furthermore, the study will establish the average growth rates during both the contraction and expansion phases of the economic cycle for each city and M.A. Additionally, it will analyze the inflow and outflow behavior within these clusters during recessionary periods. These analyses aim to reveal the underlying patterns observed in certain cities. To achieve this, we leverage labor occupation data from the National Administrative Department of Statistics of Colombia from the moving quarter of January-March 2007 to April-June 2023. This dataset covers 23 cities and metropolitan areas and serves as an input for the Markov-switched panel approach developed by Hamilton and Owyang (2012). Employing Bayesian methodologies, this approach incorporates cross-sectional and longitudinal time-series dimensions for comprehensive analysis.
Our analysis using the chosen methodology revealed three key findings. First, cities where the logistics and accommodation sectors employ a significant portion of the workforce tend to be more resilient during economic downturns. Conversely, cities and metropolitan areas with a high industry concentration exhibit lower volatility in both growth and recessionary periods. These characteristics explain the observed heterogeneity in growth rates across different economic cycles in various cities and metropolitan areas.
Second, the model identified four clusters, revealing that most cities and metropolitan areas belong to multiple clusters with varying probabilities. This suggests that most cities and metropolitan areas follow a similar business cycle, though not exclusively.
Third, the data show that cities and metropolitan areas experience recessions more frequently than the nation. Additionally, the Great Recession of 2008 initially impacted on all cities and metropolitan areas, though some recovered before it officially ended. In contrast, the Covid-19 pandemic triggered a recession that affected all cities and metropolitan areas and persisted throughout its duration. In both cases, the data suggest that contractions in cities and metropolitan areas began before the national recession dates recognized in economic literature.
The findings of this study bear significant implications for regional economic policy. As Beraja et al. (2019) point out, it is essential to consider both regional and aggregate fluctuations to comprehensively understand national business cycles, given the notable disparities in economic conditions among regions. In Colombia, as observed in their analysis, divergent responses are noted at the regional level compared to the national economy regarding the recurrence and duration of business cycles. Highlighting the role of employment types in cities in shaping local economic cycles, examining these varied regional responses becomes crucial. In this regard, it is important to consider the specific characteristics of each region's business cycle behavior when formulating economic policies. Doing so would enable governments to implement differentiated strategies of countercyclical measures during recession times in specific cities. As a basis for this approach, it is proposed to begin with factors that allow some cities to be more resilient or to recover more swiftly from recessionary periods. Simultaneously, efforts should be made to enhance these characteristics in cities that possess them.
The rest of this document is structured as follows: Section 2 discusses regional business cycles and presents clustering studies in Colombia. Section 3 outlines a Bayesian Markov-switching model for regional business cycle analysis. Section 4 describes the employment data, covariates, and seasonal adjustment methodology. Section 5 scrutinizes the obtained results. Section 6 discusses the results and provides economic recommendations based on the findings, while Section 7 concludes these findings.
Literature Review
Regional business cycles
In recent decades, the study of regional cycles has gained increasing significance due to the ongoing formation of supranational organizations (e.g., the European Union) and the emerging perspective that countries are part of interconnected regional economies (Hamilton & Owyang, 2012). A central basis concerning the treatment of regional economies was postulated by Barro et al. (1991) based on the neoclassical growth model. They sought to understand regional economic convergence, indicating that poorer economies grow faster than richer ones, thus reducing regional disparities over time. Factors such as labor and capital mobility can influence the speed of convergence. Their findings indicate that achieving gradual convergence may require significant time.
After studying regional economic cycles in the United States, Carlino and Sill (1997) highlighted how economic theory approaches regional fluctuations. They identified two distinct lenses through which these fluctuations are viewed. The traditional perspective suggests that regional economic changes are temporary. At the same time, an alternative viewpoint posits that the duration of these changes can be extended depending on the region and the nature of encountered shocks. Their study involved distinguishing cycles from trends across eight regions and identifying a core group characterized by closely correlated economic cycles. They concluded that the observed regional cyclical variations have significant implications for regional economic policies due to varying levels of volatility among the regions and their differing reliance on economic cycles.
According to Cárdenas et al. (2015), New Economic Geography (NEG) studies highlight the presence of economies of scale in specific regions, promoting economic development. This development subsequently impacts employment levels. Furthermore, according to equilibrium and disequilibrium theories, differences in unemployment rates are attributed to constraints on labor mobility and the presence of incentives specific to particular areas. These perspectives emphasize the role of labor mobility constraints and regional incentives in shaping disparities in unemployment rates.
Empirical results support the existence of this phenomenon at various scales; for example, Wall (2007) employed a Bayesian approach to identify turning points in Japan's business cycles between 1976 and 2005, revealing regional differences in growth rates during periods of expansion and recession. Based on the Index of Industrial Production, the study highlights a decline in average growth and rate variations. This suggests the influence of regional industrial composition. The regional economies approach also applies to cities; illustrating this, Owyang et al. (2008) treat them as cross-sections with similar characteristics. The analysis highlights differences in economic characteristics that influence employment growth during high and low phases.
Hamilton and Owyang (2012), across multiple studies, identified notable variation in the expansion and recession phases of business cycles in the United States, with similar findings for U.S. states, particularly in regions heavily reliant on oil production and agriculture, which were more susceptible to economic downturns compared to others. In the U.K., Fingleton et al. (2012) found differences in the resilience of 12 U.K. regions from 1971 to 2010. For this, they used a vector error correction model (YECM), finding that the interlinkages of these regional economies are revealed in how they react to and recover from recessionary shocks.
In the case of the European Union, it is important to analyze not only at the national level but also at the subnational level. For instance, Gadea-Rivas et al. (2018) researched 213 European Union regions, focusing on sectoral employment to understand the regional composition and utilizing the percentage of manufacturing employment as a proxy for industrialization. They also considered the number of establishments and population in their assessment of economic policies. Conversely, Wang et al. (2023) used the business cycle of Chinese provinces using industrial linkage as a reference to validate their resilience in the economic cycle, finding differences in the timing of recession between them and the national economy.
In the Latin American context, a study by Haddad et al. (2002) in Brazil used a general equilibrium analysis approach to examine the economic interconnections between regions. The research highlighted the imbalances in international trade among regions, which could be due to the implementation of regional trade agreements. These agreements may also worsen the differences between states over time. Kondo (2022) also investigated regional cycles in Mexico by studying the indirect spatial effects through a Markov switching model for a data panel. The study focused mainly on Mexican states that showed an increased synchronization with the country's overall economic cycle.
The Link between Economic Cycles and Employment
Multiple studies have linked some employment rates used as a dependent variable in the economic cycle (Zuccardi, 2002; Bohórquez et al., 2009; Hamilton & Owyang, 2012; Gadea-Rivas, 2018). This relationship was pointed out by Rissman (1999), who highlighted the importance of investigating how fluctuations in regional employment affect the economic cycle, developing a model that uses a Kalman filter to infer a common factor that differentially affects different regions. She concluded a significant relationship exists between employment at the regional level and the business cycle in the United States.
Bohórquez et al. (2009) assert that, within the business cycle theory, researchers have identified various relationships among variables like consumption, investment, and employment across the temporal dynamics of GDP. These relationships take shape within concepts such as rational expectations and Walrasian equilibrium. Beraja et al. (2019) clarify the connection between employment and the business cycle, treating employment as a sensitive indicator to economic fluctuations. Their study, spanning both aggregate and regional data analysis, confirms that changes in domestic demand in the United States significantly impact national-level employment. The employment growth rate proves to be a practical tool for examining regional business cycles. Utilizing a Neo-Keynesian model, the researchers identify ordinary equations between regional and aggregate economies during the Great Recession, emphasizing the equality of wage Phillips curves under specific assumptions. Incorporating regional data into the overall model enhances the understanding of wage dynamics, uncovering notable variations in the flexibility of wages within the context of employment and the business cycle.
Studies on Regional Economies in Colombia
A review of the academic literature on regional economic analysis in Colombia reveals a lack of economic convergence among its regions and inconsistencies in defining similar economic areas. This lack of convergence stems from variations in methodological approaches, the regions studied, and the characteristics of the datadata characteristics employed. One of the earliest studies was conducted by Barón (2002), who utilized the level of deposits in the financial system as input data. The data was collected quarterly for 24 departments, employing a process know as VARCLUS, available in the SAS statistical software, to group the variables into hierarchical clusters.2 However, it is important to note that this method was exploratory and descriptive rather than inferential. Zuccardi (2002) also attempted to characterize a set of clusters applied to cities. To do so, he used the labor occupation growth rates of seven metropolitan areas in Colombia between 1986 and 2000, evaluating their average annual growth level. He employed a cohesion force that captured the degree of co-movement between national economies, finding that the areas did not converge in an equilibrium relationship.
Bohórquez et al. (2009) investigated how employment rates link cities and the national economy. Using unrestricted VAR models, they analyzed employment cycles in 13 metropolitan areas. This revealed two key findings. First, they identified cities with more adaptable employment trends, categorized as either less influenced by national factors or more synchronized with other cities. Second, the study explored how geographic proximity and population exchange influence regional interdependencies. They discovered that larger cities often precede or influence the employment cycles of smaller, nearby cities. In some cases, the cycles of larger cities could even accurately predict employment patterns in the smaller cities they impact.
Quintero Otero and González (2012) investigated the impact of monetary policy in the Caribbean, Central Andean, and Pacific regions of Colombia, using geographical criteria to define these regions beforehand. They used panel data of quarterly GDP at the national level and the annual growth of the cyclical component of regional GDP between 2002 and 2010. Their findings show that monetary policy shocks affect the economic cycle in these regions in a non-uniform manner, with the Caribbean region being the most affected. They found that monetary policy has a differential impact in regions with greater export openness and those with greater importance in the mining sector. However, no differential effect was observed in departments with high industrial production. The methodology overcame the limitation of the annual regional data series by employing direct projections instead of the standard structural vector autoregression approach. Cárdenas et al. (2015) analyzed structural factors impacting unemployment in 23 cities and metropolitan areas using multiple-factor analysis for multiple contingency tables (MFACT). They employed 185 variables to identify underlying factors influencing employment differences, focusing on age structure and labor participation incentives. Their approach revealed five axes via Ward's criteria, showing that cities with high unemployment did not consistently share the same structure, contrary to prior studies. However, the study lacked assumptions about the multivariate distribution under the MFACT model, limiting statistical inferences. Six distinct clusters emerged, each with unique characteristics, highlighting the diversity in unemployment determinants. These clusters did not exhibit a shared geographic distribution, except for a cluster comprising some cities along the Colombian Caribbean coast, which had low unemployment rates, high labor participation, and large household sizes.
Meanwhile, Gómez Sánchez et al. (2022) focus on analyzing Colombia's regional cycles, dividing the country into four geographically continuous regions in their view, with a fifth region covering areas with the highest economic activity (Bogotá D.C., Valle del Cauca, and Antioquia). Their objective is to highlight the importance of the relationship between regional business cycles and manufacturing productivity in Colombia. Using a methodological approach that combines econometric models such as the system of general methods of moments, the Kalman filter, and VARX models, they conclude that there is a pro-cyclical and non-contemporaneous causal relationship from productivity to GDP in the more developed regions. In contrast, in other regions, the relationship is counter-cyclical and non-contemporary, indicating that economic policy should support the manufacturing sector with subsidies, access to capital, and promotion of international trade to improve competitiveness.
Romero (2023) analyzed historical departmental GDP data in Colombia to examine regional inequalities. She found that national GDP historically concentrated in departments in the inter-Andean valleys, mountains, and Caribbean coast. Over a century, these departments dominated national production, especially in oil-producing areas, while border departments showed marginal growth. Romero identified a pattern of weak convergence and divergence since the 1990s and a procyclical relationship between public spending on education and health and regional production. She used nine data points between 1918 and 2019, employing a methodology that extrapolates production-related variables and incorporates DANE data from 1985 to 2019. The Colombian Departmental Competitiveness Index 2023 (Cheyne García, et al., 2023), not only evaluated the competitiveness of the country's 33 first-order territorial entities but also grouped them into clusters. To achieve this, strategic quadrants were created to identify the potential and strengths of each entity, using the Departmental Competitiveness Index (IDC) and the Weighted Growth Index (ICP), which involved 108 indicators grouped into 13 pillars. Based on these analyses, Ward's hierarchical cluster classification and the k-means method were applied to identify six different clusters. Three of these clusters shared geographic continuity, while three did not. Additionally, the study indicated the specific strengths and weaknesses of each cluster.
Methodology
The methodology developed by Hamilton and Owyang (2012), which has gained recognition for its effectiveness in analyzing panel data with covariates, utilizes an exploratory method. This approach has been applied in various studies characterizing regional business cycles (Hernández-Murillo et al., 2017; Kondo, 2022; Wang et al., 2023). Unlike predefined groups, geographic units are clustered based on their own economic characteristics. This allows researchers to identify shared features and analyze regional recessions specific to each resulting cluster. This approach has revealed significant variations in the expansionary and recessionary phases of regional economic cycles across US states.
Hamilton and Owyang (2012) defined co-movement in the commonality of regions based on regional clusters derived from employment growth rates. They delineated the business cycle as discrete transitions between expansion and recession phases. The methodology involves a probabilistic framework based on time series models and stochastic processes, emphasizing Bayesian inference.
The practical application utilizes Gibbs sampling to sequentially generate values for variables of interest, such as latent states, transition matrices, and structural parameters. A cross-validation approach is employed to evaluate model performance, addressing steps such as regime generation and parameter updating using Markov chain Monte Carlo. This methodology facilitates data grouping into regional clusters, considering the correlation between employment growth rates and covariates. The probability of belonging to each cluster is modeled as a logistic variable, and inference is drawn based on the observed regional correlations in employment growth.
Markov model and Bayesian analysis
This section presents the Hamilton and Owyang (2012) approach for identifying clustered business cycles and determining endogenous divisions within clusters.
Let y tn denote the employment growth rate in region n at time t, and y t represents an (N x 1) dimensional vector comprising all employment observations for the N geographic regions at time t. Additionally, let s t be an (N x 1) dimensional vector following a Markov chain containing recession indicators, where s tn = 1 when region n is in recession and s tn = 0 when it is in expansion. Consider Eq. 1:

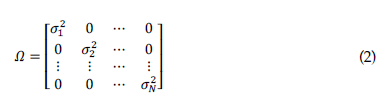
During expansion phases, μ0 signifies the mean employment growth in region n on average, and μ0 + μ1 represents the mean growth experienced during recession phases. The operator ⊙ denotes the Hadamard product, a mathematical operation entailing the pairwise multiplication of corresponding elements. According to the model, recession phases are proposed as the main driver of changes in job creation within regional units. The error term ε t is modeled to conform to a normal distribution with mean zero and variance Ω as outlined in Eq. 2. Another assumption is that the Ω is diagonal, which reduces the number of variance parameters. This is necessary for the algorithms used in the analysis.
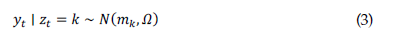
The model suggests that simultaneous economic downturns drive correlated employment growth across regions. While assertive, this perspective offers insight into how the business cycle spreads regionally. Addressing the model’s complexity, arising from the substantial number of states and intricate relationships requires additional simplifications; hence, a cluster-based approach is employed. The premise posits that the recession process can be grouped into a small number of clusters K << 2N, alongside an aggregate indicator z t ∈ {1, 2, …, K} that indicates if a recession is happening in cluster k at a given time t. Determining these cluster patterns involves considering a h nk cluster index, where the nth component equals 1 if region n is affiliated to cluster k, and 0 otherwise. All the regions belonging to cluster k are in recession when z t = k. Regional dynamics are delineated through Eq. 3:
Describing mk, as in Eq 4:
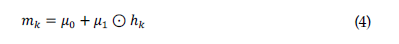
In a Markov-switching model, states h1, h K are crucial for inference but estimating them from data is challenging. We set priors: h K = 0 (expansion) and hK-1 = 1 (recession). Other states (idiosyncratic) are grouped as K = K - 2. The values of h1, h K are unobserved but influence the probability distribution of the observed data [y t }t T =1. Subsequently, the existence of a vector x nk with dimensions (Pk x 1) of covariates influencing whether a region n experiences a recession z k = k is treated through a logistic model in Eq. 5:
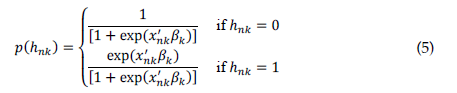
The parameter β k is interpreted as a logistic clustering parameter for the entire population. Realizing Eq. 5 is impossible at this stage because the values hk are unavailable. Therefore, latent variables ξ nk and ψ nk , are introduced, defined as follows: ξ nk = x' nk β k + 2ψ nk e nk , where ψ nk ∼ KS and e nk ∼ N(0,1). The variable ξ nk takes on a logistic distribution with a mean determined by x' nk β k . The cumulative distribution function of ξ nk is given in Eq. 6:
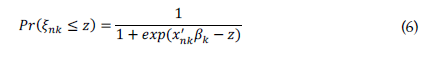
Therefore, it is found Eq. 7:
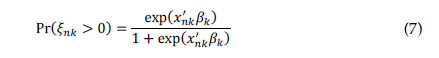
In simpler terms, if consider ξ nk generated from N(x' nk β k , λ nk ) distribution where λ nk = 4ψ2 nk for ψ nk ∼ KS and set h nk to 1 when ξ nk > 0, it is like saying that hnk was determined based on the probability specified in Eq. 5. In the realm of data analysis, the objective lies in deriving Bayesian posterior inferences for both population parameters and unobserved latent variables. Within this study, these variables are categorized into distinct groups. The regional economic growth is represented by the indicator θ = {μ0,μ1,Ω} and a transition probability matrix P. There are also two types of latent variables exist: a vector z = (z 1, …, z T )' indicating recession clusters at each date, and h = {h 1, …, hκ} indicating the affiliation of each geographic region, where hk = (h 1k , …, h Nk )' characterizes regions in cluster k. Variables ξ k = (ξ 1k , …, ξ Nκ )' and λk = {λ 1k , …, λ Nκ }' are auxiliary variables determining hk, as per Eq. 8:
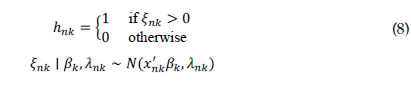
Where ξ nk ∣ β k , λ nk ∼ N(x' nk β k , λ nk ), λ nk = 4ψ2 nk and ψ nk ∼ KS. All unobserved variables related to cluster memberships are represented by H = {h,ξ,λ}, in this context ξ = {ξ1, …, ξκ}, λ = {λ1, …, λκ}, and β = {β1, …, βκ} signifies the collection of logistic coefficient vectors. Subsequently, Bayesian inference is employed for parameter estimation. To initiate this process, a series of initial assumptions are required by the model, as detailed in Table 1:
Table 1
Foundations for Estimating Parameters

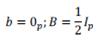
[i]Note: The number of covariates is denoted by p, which is the dimension of the vector x; n ∈ {1, …, N} corresponds to the geographic region; k ∈ {1, …, K} signifies the quantity of clusters; normal priors are established for both μ and β, inverse gamma priors for σ2 n , and a Dirichlet distribution serves as the prior for P .
The simulation's growth assumptions involve an average annual employment growth rate of 0.5% during expansion, with a probable range from -0.5% to 1.5%. Conversely, the average employment growth in a recession is expected to range from -2% to 0%. These figures approximate Colombia's labor participation growth rate between 1983 and 2014, as Arango et al. (2016) summarized.
The following steps generate the joint distribution of variables, laying the foundation for modeling. Subsequently, the discussion delves into generating random samples, providing detailed explanations on obtaining the necessary values. This process encompasses generating fundamental parameter samples, transition matrices, and latent states of the model, addressing essential issues like identifiability, and handling uniqueness problems in parameter estimations and transition matrices. The estimation of the model depends on a predetermined number of clusters, denoted as K, posing a typical model selection challenge. This strategy utilizes k-fold cross-validation and the marginal likelihood function to establish K.
The dataset Y t is split into R = 2 folds for cross-validation. Evaluation utilizes a score measuring the discordance between observations and predictions, employing an entropy loss function. The score is computed for each block, aiming to minimize it by weighing the difference with the inverse of the covariance matrix. The selection of the cluster count aims to minimize this overarching score across all cross-validation iterations. We will set the range of clusters range from K = 2 to K = 5 to be the minimum and maximum number of clusters tested. For each value of K, the Gibbs sampler will be run for 2,500 iterations. An initial set of 25,000 iterations will be discarded as they represent a warmup phase.
Data
While other works have explored the utilization of GDP as a more suitable dataset to validate growth or decline in the economic cycle, as evidenced in several research studies (Barón, 2002; Hamilton & Owyang, 2012; Kondo, 2022; Wang et al., 2023), challenges arise in obtaining this data, often due to a lack of information or limitations in the number of observations. In Colombia, the National Administrative Department of Statistics (DANE, by its Spanish acronym) only publishes annual departmental GDP values since 2005, with coverage excluding some departments. Consequently, the employment growth rate emerges as the alternative proxy, aligning with the literature indicating a robust correlation between employment growth and the economic cycle, as mentioned in the literature review. However, the availability of employment growth data at the departmental level in Colombia is limited to annual records starting from 2001, making it challenging to study due to a scarcity of observations. 3 Considering this limitation, we use labor occupation data from 23 cities and metropolitan areas, offering advantages with its monthly provision corresponding to a moving quarter, spanning January-March 2007 to April-June 2023. This approach yields more observations than the limited annual records and encompasses 23 departments out of 32, ensuring a comprehensive dataset derived from the Integrated Household Survey conducted by DANE (2023a).4
The panel data set used was the rate of employment growth in employment defined by ratio 9:
This rate is calculated as the number of people divided by the labor force, which includes all working-age individuals who are employed or actively seeking employment.5 The employment growth rate is given by ratio 10:
The model also requires a set of covariates associated with each city and M.A. that characterize the pre-event probability of belonging to a given cluster. For this purpose, we identify four specific covariates: the percentages of individuals employed in manufacturing industries, financial and insurance activities, logistics and accommodation activities, and the registered companies per 1000 inhabitants.6 The selection of the manufacturing employment share is based on its role as a primary indicator of a city's productive capacity. In contrast, opting for personnel engaged in financial and insurance activities reflects a locality's economic dynamism concerning financial investment, which is crucial for resource allocation and assessing the city's ability to mobilize capital. These two factors align with the choices made by Hamilton and Owyang (2012). Furthermore, the employment proportion in logistics and accommodation, which covers the transportation and storage sector and the accommodation and food services sector, contributes to better classification and clustering since these sectors often concentrate in specific cities. Finally, the number of companies per inhabitant is a relevant metric as it diversifies the economic structure, reduces dependence on specific sectors, and strengthens the city's ability to adapt to economic changes.
Seasonal adjustment of the data
The data provided by DANE are not seasonally adjusted, requiring the removal of seasonal effects. We implement the X-13ARIMA-SEATS method, a statistical technique for seasonal adjustment and time series analysis created by the U.S. Census Bureau - the government agency responsible for generating demographic and economic data for the United States.7 This method decomposes the time series into trend, seasonality, and irregularity components using iterative techniques of centered moving averages. It provides a seasonally adjusted series along with quality tests and statistics. A comprehensive validation process was conducted for each of the 23 series to ensure the robustness and reliability of these adjusted series. This validation included tests for normality of the residuals with the Doornik-Hansen test, linearity of residuals with the Ljung-Box test on squared residuals, and independence of seasonal residuals with the Ljung-Box test on their autocorrelation. These tests address critical assumptions for subsequent analysis.
Covid-19 seasonal effects
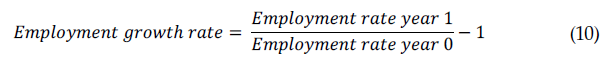
The Covid-19 pandemic has significantly altered the behavior of various economic indicators. Consequently, addressing its impact on data seasonal adjustment becomes imperative. To accomplish this, we will adopt the intervention analysis methodology proposed by Foley (2021). This method is designed to address distinct anomalies in series data and is employed to mitigate the effects of non-seasonal events on the seasonal pattern of economic data. Figure 1 shows the four most common anomalies or outliers in a series.
Additive Outliers (AO) are values that deviate significantly from the typical series pattern, usually at isolated points or the final point of a time series. Temporary Changes (TC) indicate a transient series shift, characterized by an immediate change followed by a swift return to the original state, often due to factors like holidays or one-time events. Level Shifts (LS) suggest a sudden and sustained baseline alteration, often from structural changes such as policy adjustments or economic shifts. Linear ramps (RP), used for modeling gradual trends over time, resemble LS but allow a smoother transition between levels (Foley, 2021). For the seasonal adjustment of data and the detection of outlier anomalies, we utilize the open-source seasonal adjustment software JDemetra, developed by the European Union Statistics Agency-EUROSTAT-and the package developed for R software, RJDemetra.8 While the statistical package automatically identifies outliers, Foley (2021) and statistical agencies stress the importance of manual identification during the Covid-19 pandemic.9 The software frequently overlooks these effects. Consequently, all Covid-19 phase outliers underwent manual analysis for each series, focusing on outlier characteristics, and were then incorporated into the seasonal adjustment model based on the most suitable outlier type determined through series analysis. This meticulous approach ensures thorough outlier detection and incorporation, as recommended by experts.
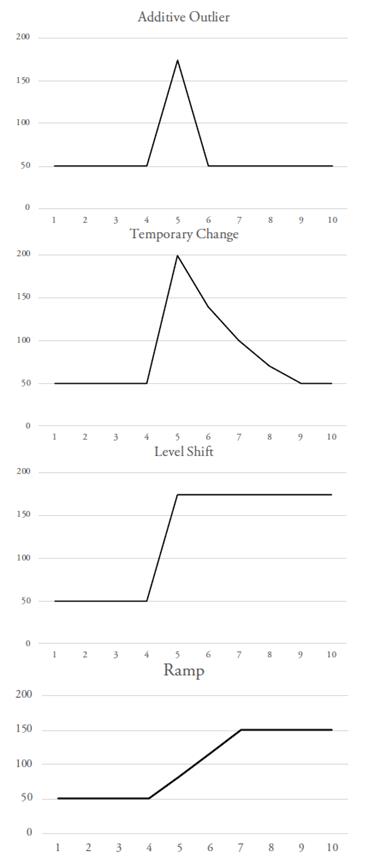
Figure 2 exemplifies this process by showcasing a manual adjustment to the time series for the city of Santa Marta during the pandemic. Our manual inspection revealed four outliers corresponding to distinct observation periods and one level shift, whereas the automated system only detected a single outlier within the displayed timeframe. Given the widespread impact of Covid-19 across the areas studied, its inclusion in the research analysis is crucial for capturing the complete picture.
Results
Employment growth by city and metropolitan area
Figure 3 depicts seasonally adjusted average employment growth across 23 cities and metropolitan areas. Notably, the pre-pandemic period exhibited stable growth, maintaining an average close to zero. Growth and decline variations were generally modest, rarely exceeding three percentage points, except for the city of Quibdó, which notably emerged as the most volatile during this period.
The impact of Covid-19 on the data series becomes apparent starting from the moving quarter of January-March 2020, intensifying notably in the March-May 2020 quarter, coinciding with the initiation of the mandatory national quarantine in Colombia.10 Throughout the quarantine, the most significant moving quarterly decrease in the average of all cities, at -6.05%, occurred in March-May 2020. Conversely, the peak average growth for all cities, at 2.99%, occurred four months later in July-September 2020. Neiva exhibited both the lowest and highest values in growth and decrease, recording -11.35% and 11.75%, respectively, and displayed the highest volatility among all cities. In contrast, Quibdó demonstrated countercyclical behavior, growing during the March-May 2020 quarter when other cities decreased and experiencing a decrease in the June - August 2020 quarter amid generalized growth-a pattern consistent with cities characterized by high rates of labor informality (Gómez, 2013). A gradual convergence toward pre-pandemic levels is observed from the December 2021-February 2022 quarter, three months after the end of the mandatory quarantine in Colombia.
Growth coefficients in periods of expansion and recession
According to the employed methodology, the iterations yield average growth rates for expansion periods denoted as (μ 0) and recession periods denoted as (μ0 + μ 1) in each city. Additionally, the methodology calculates the rate of residual variance (σ2) in the growth rates. Figure 4 shows these coefficients.
Figure 3
Average employment growth of 23 cities and metropolitan areas of Colombia
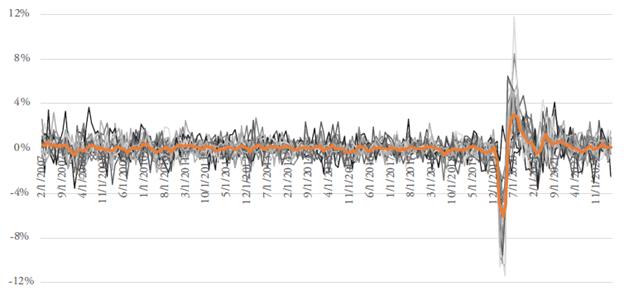
Note: The average of the 23 series is highlighted in orange..
Source: Own elaboration.
Figure 4
Average growth coefficients of 23 cities and metropolitan areas of Colombia11
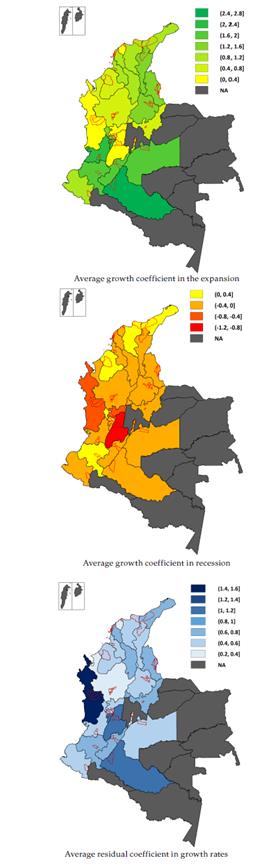
Source: Own elaboration.
Concerning the growth rate during the expansion, no typical geographic pattern is observed, with an average of 1.14% growth among all entities. The city of Barranquilla exhibits the lowest growth value at 0.13%, closely followed by Quibdó with 0.16% and Manizales with 0.22%. The noteworthy underperformance of Barranquilla is significant, especially considering its prominent role as an industrial pole in the country (Otero-Cortes et al., 2023). However, it is crucial to note that this city has consistently been characterized by an informality rate exceeding the national average. Additionally, despite the observed dynamism in the city's industrial sector, the jobs generated exhibit significant deficiencies in job security, wages, and benefits (Otero-Cortes et al., 2023); this may be attributed to the fact that the labor supply in Barranquilla has experienced higher growth than the demand for employment (Galvis-Aponte et al., 2019). In Quibdó, the low growth rate is possibly explained by persistent unemployment rates and the reception of a displaced population in an already precarious labor market (Robledo-Caicedo, 2019). In Manizales, as per the analysis conducted by Guarín (2017), it is evident that, from a productivity-oriented perspective of the industrial system, the city has witnessed a decline in the vitality of coffee plantation activity. Historically, this sector served as the engine of its economy. This decline has resulted in a lack of diversification and sophistication in the productive apparatus, limiting the generation of quality jobs during periods of economic growth.
Among the cities displaying greater dynamism during expansion periods, Florencia leads with a remarkable growth rate of 2.62%. Regrettably, there is a lack of academic studies supporting the city's boom during expansion periods or analyzing employment dynamics within. However, some studies highlight its high unemployment rate at the national level, surpassing the average of the 23 major cities and exhibiting a general upward trend (Robledo-Caicedo, 2020). Notably, Florencia serves as the capital of one of the departments most affected by the internal conflict in Colombia. Thus, it is plausible to theorize that the city's economy experiences remarkable growth concurrently with the materialization of peace agreements reached by the government with the insurgency (Rivera & Echeverri, 2020). Next, the city of Armenia boasts a commendable growth rate of 2.22%. Despite limited literature addressing Armenia's dynamic growth, Barrantes (2021) emphasizes the persistent issue of unemployment in the city over the years. It is crucial to note that Armenia and five other jurisdictions enjoy income tax benefits for new companies engaged in specific activities, facilitated through a special regime known as Zona Económica y Social Especial (Special Economic and Social Zone).12 However, precise figures regarding its impact on employment generation or its contribution to the increased formation of companies in this city remain elusive (Barrantes, 2021). In addition to the regions benefiting from this scheme, Armenia's central geographical position within the golden "triangle of the country" (a term coined to represent an imaginary triangle among the three largest cities in Colombia) is noteworthy.13 Cali ranks third in average growth in expansion cycles, with 2.07%. As noted by González and Mora (2011), the city has distinguished itself by recurrent cycles of economic acceleration and deceleration, incorporating into its labor force not only residents of its metropolitan area but also residents of surrounding municipalities in the region. According to Ortiz and Uribe (2007), Cali has historically been characterized as labor-intensive; therefore, it can more easily benefit from the ample supply of available jobs during periods of economic growth. A discernible pattern is generally observed in these cities, aligning with studies correlating higher unemployment rates and increased employment generation due to demand shocks (Bartik, 2015).
When evaluating the average coefficients during recessionary periods, an overall average growth coefficient of -0.14 is identified across all entities. Despite this, five cities exhibit positive growth (Popayán, Pereira M.A., Riohacha, Monteria, and Santa Marta), albeit all very close to 0% (less than 0.03%). Among the remaining 18 cities, 13 fall within the range of [-0.1%, 0%). Ibagué stands out with the lowest growth coefficient of -0.96%, attributed to its elevated unemployment rates compared to the national average, higher overall participation rate and low economic growth (Ayala-García, 2014). Manizales follow this with -0.60% and Quibdó with -0.58%. Furthermore, a positive correlation of 0.31 is observed between the proportion of people employed in logistics and accommodation services and the growth coefficient during recessionary periods; this suggests that cities with a higher focus on tourism may exhibit greater resilience during these times compared to other cities.
The growth rates mentioned earlier should be assessed in conjunction with the residual variability rates of the coefficients. Among the cities, only Quibdó (1.58%) and Ibagué (1.16%) surpass the 1% variability assumption. Considering Quibdó's historically volatile growth rates, the mentioned figure does not appear notably abnormal. However, it sheds light on the nuanced low growth of Ibagué during the recessionary periods. Conversely, Bogotá D.C. (0.27%), Barranquilla M.A. (0.30%), and Medellín M.A. (0.36%) exhibit the lowest volatility. Notably, Bogotá D.C. and Medellín M.A. stand out with employment rate growth during expansion periods (0.72% and 0.79%, respectively). Furthermore, their growth coefficients are close to 0 in recession periods (-0.02% and -0.001%, respectively), indicating a more stable long-term employment growth than other cities. Historically, Bogotá D.C. maintained economic growth rates above national averages until the mid-2000s, and while its growth rate has decreased, it has followed a stable trajectory (Guzman et al., 2017). In the case of Medellín, despite not having lower unemployment rates compared to other cities, studies indicate higher-quality employment and lower informality rates (Sanchez, 2013). These factors, coupled with the city's high industrial density and market potential (Cárdenas et al., 2015), may contribute to a lower loss of labor occupation during economic downturns, underscoring Medellín's strengths. Supported by a negative correlation of -0.50, cities with higher proportions of people employed in manufacturing industries exhibit lower variability in growth rates, indicating greater stability in the growth rate of these cities.
Identified Clusters
The modeling process identifies clusters of cities and metropolitan areas that share a tendency to synchronize their economic cycles. Four clusters, which are not mutually exclusive, are delineated based on this shared behavior. It is important to note that this likelihood varies across clusters. In our analysis, a city is categorized as belonging to a cluster if its affiliation probability exceeds 0.5.
Cluster 1 encompasses 18 cities with a probability of belonging that exceeds 80%. These cities include Bogotá D.C., Medellín M.A., Cali M.A., Bucaramanga M.A., Pasto, Pereira M.A., Cúcuta M.A., Montería, Villavicencio, Florencia, Popayán, Valledupar, Neiva, Riohacha, Santa Marta, Armenia, Cartagena, and Sincelejo. Additionally, Tunja has a probability exceeding 50%. Notably, 19 out of the 23 cities analyzed are present within this cluster, indicating a high level of inclusion and suggesting a generalized behavior across most cities. As for Cluster 2, only nine cities surpass 80%: Cali M.A., Bucaramanga M.A., Florencia, Valledupar, Popayán, Bogotá D.C., Tunja, Manizales M.A. and Pereira M.A. Furthermore, three cities-Medellín M.A., Quibdó, and Cartagena-exceed 50%. This cluster excludes most Caribbean cities and some southern cities. Cluster 3 exhibits uniform behavior with all cities having a probability of participation in this cluster above 80%. Cluster 4 identifies 15 cities with a probability of belonging that surpasses 80%, including Cali M.A., Florencia, Valledupar, Armenia, Cartagena, Pasto, Santa Marta, Montería, Pereira M.A., Villavicencio, Popayán, Riohacha, Cúcuta M.A., Neiva, and Sincelejo. It is important to note that this cluster does not encompass several cities in the central region of the country and the city of Barranquilla and Quibdó. Figure 5 visually represents these clusters on a map, highlighting the probability that each city or metropolitan area is associated with a specific cluster.
Figure 5
Cluster affiliation probabilities identified in 23 cities and metropolitan areas14
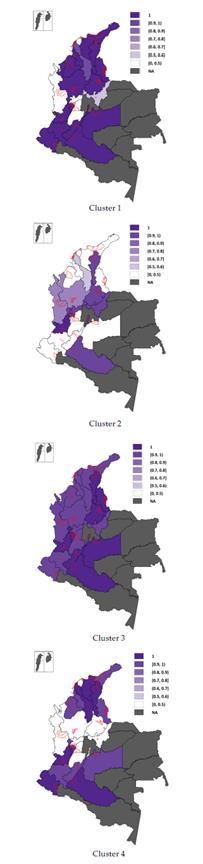
Notes: A city or M.A. is assigned to a cluster if it has a posteriori affiliation probability greater than 0.5 for that cluster.
Source: Own elaboration.
The first and third clusters exhibit a more national character, as most cities either belong to the same cluster or have a high probability of belonging. Therefore, extracting correlations with covariates in these cases is not feasible. In Cluster 2, a correlation of 0.41 is observed with the proportion of people employed in financial and insurance activities and -0.39 with the proportion of people employed in logistics and accommodation activities; this aligns with the low probability of including cities in the Caribbean region, whose economies are heavily reliant on tourism. For Cluster 4, a correlation of -0.58 is found with the proportion of people employed in financial and insurance activities and 0.54 with the probability of belonging to logistics and accommodation. In broad terms, this cluster hosts cities with a low proportion of workers in the financial sector, dependence on sectors related to tourism and logistics, and a lower concentration of firms (with an average of 18.78 compared to 24.99 in cities not included in this cluster).
Despite these differences, 19 cities share at least two clusters, and six cities simultaneously belong to all clusters. Therefore, interpreting the results of the cluster groupings should be done cautiously, as there might be some uniformity among some cities composing them, with variations in the probability of belonging to a specific cluster. While Clusters 2 and 3 show some geographical continuity, our investigation focuses on the city and M.A. level. Here, economic disparities and city-specific characteristics may differ from those of higher-ranking subnational entities. Additionally, as Duranton (2015) highlighted, the road traffic conditions within the country significantly influence trade within urban centers. This underscores that the economic characteristics of these cities are more pivotal than the actual volume of trade between them. These findings are further supported by research conducted by the Colombian System of Cities, which underscores the relative isolation between these cities and indicates that their economies lack significant specialization (CONPES, 2014). Therefore, this continuity cannot be directly compared with previous studies on subnational administrative regions. Given the considerations above, the results of our study differ from the more exclusionary cluster patterns observed in the United States by Hamilton and Owyang (2012) in their statelevel study. Instead, our findings exhibit more similarities to the province-level results in China, as reported by Wang et al. (2023).
Clustered business cycles
Figure 6 presents the mean probabilities of national expansion, national recession, and recession occurrence for each identified cluster, estimated using Markov panel switching with the data incorporated into the model. It is crucial to emphasize that "national expansion" and "national recession" denote shared states experienced by all cities. Two distinct recession events unfolded in Colombia throughout the study period, each associated with pivotal economic occurrences: the Great Recession from the subprime mortgage crisis and the Covid-19 crisis from 02/01/2020 to 04/01/2020 (Arango et al., 2016; Fedesarrollo, 2020; Posada, 2020).15
Figure 6
Posterior Probabilities of aggregate regimes
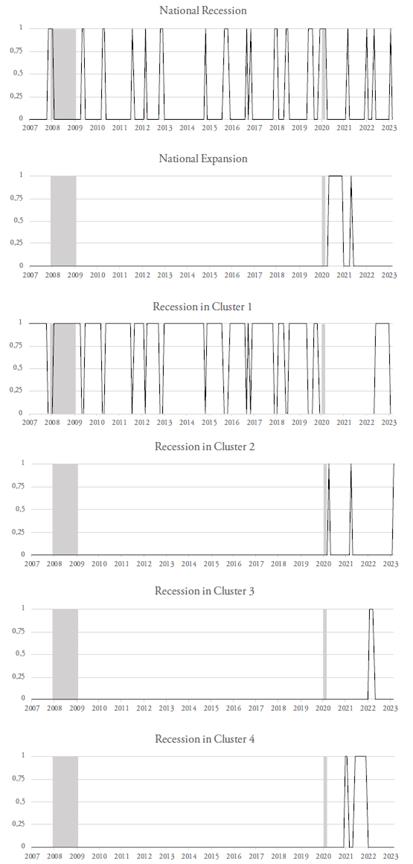
Notes: Posterior Probabilities are monthly, reflecting the moving quarter. Shaded areas align with the periods identified as national recessions according to the nber methodology.
Source: Own elaboration.
Cities in cluster 1 consistently undergo prolonged and recurrent recessionary periods. However, the onset of the Covid-19 pandemic has altered the established similarities in the behavior of the country's cities. Before this event, only four cities-Quibdó, Manizales M.A., Barranquilla M.A., and Ibagué-did not follow the same recessive economic cycle. This behavior is interesting because although the average growth rates of the city analyzed are the lowest among the entities studied, it has experienced more sustained growth over time than other cities. This phenomenon explains, to a large extent, the economic growth of Barranquilla in recent years (Otero-Cortes et al., 2023), as well as the countercyclical behavior of Quibdó in contrast to most other cities. Post- Covid-19, the model identifies three additional clusters. Cluster 2 consists of cities that undergo an additional moving quarter of the Covid-19 recession compared to other cities, while nearly half of the cities emerge from this recession. Notably, several cities in the Colombian Caribbean are excluded from this cluster. 16 Cluster 3, demonstrating behavior akin to a national recession, with all cities in this cluster having a probability of belonging exceeding 90%, persists for three consecutive moving quarters starting in early 2022. This occurrence can be viewed as an extension of the national recession that began in February-March 2022. In Cluster 4, two distinct recessionary periods emerge. However, cities such as Quibdó, Medellín M.A., Bucaramanga M.A., Barranquilla M.A., Bogotá D.C., Tunja, Ibagué, and Manizales M.A. deviate from the recessive behavior associated with this cluster, spanning nine moving quarters.
Examining the cluster's behavior during national crisis events reveals that the impact of the Great Recession is evident in all cities during the moving quarter from December 2007 to February 2008, sustaining until February 2008 to April 2008. However, cities in cluster 1 continued to be in a recessionary state until the moving quarter of May-July 2009. In the Covid-19 crisis, despite cluster 1 cities already being in a recession, it is theorized that this extension is unrelated to the pandemic's nature, given its unexpected nature. The widespread impact of this crisis on all cities was detected from January 2020 to March 2020, continuing until April-June 2020. Only cluster 2 cities experienced an additional quarter of recession. Subsequently, a prolonged expansion period for all cities unfolded in the following moving quarter from July-September 2020 to January-March 2021.
Regime Transition Probabilities and Logistic Coefficients Analysis
Table 2 presents the regime transition probabilities denoted as p ij , illustrating the likelihood of the economy transitioning from one regime at time t, to another at t + 1. The transition probabilities between different clusters are not feasible. For instance, suppose z t = 1 in quarter t; this signifies that only cities or metropolitan areas (M.A.) included in cluster 1 would be in a recession. It has been predetermined that these cities and M.A. cannot emerge from the recession, and a distinct subset of cities and M.A. begins a recession at t + 1. To achieve this, the constraint P j = 0 is enforced, eliminating such transitions' possibility.
Table 2
Estimated transition probabilities
Based on the findings, it is observed that the probability of transition-ing from a state of national recession to a state of expansion, or vice versa, is zero. Consequently, national expansions and contractions do not unfold sequentially; instead, they typically originate in specific cities and metropolitan areas before gradually extending to encompass all the examined cities and metropolitan areas. Cluster 1 displays the highest likelihood of staying in the same regime. Cluster 2, having only one expansion quarter, has an absolute probability of transitioning into the expansion regimen. Clusters 3 and 4 exhibit a greater likelihood of experiencing national downturns compared to cluster1. Our results indicate that downturns are expected to persist with a high probability in the subsequent period across all clusters, except for cluster 2.
Table 3 presents the posterior means of the logistic coefficients ßk associated with each idiosyncratic cluster k, with highlighted entries indicating instances where at least 68% of the calculations yielded consistent directionality compared to the inferred mean. These results allow us to identify patterns in the probability of belonging to each cluster. The interpretation of the logistic coefficients ßk is that for holding all other variables constant, a one-unit increase in the corresponding covariable associated with ß k is linked to an increase in the logarithm of the odds regarding covariable membership.
Table 3
Estimated logistic coefficients
In the examination conducted, it is highlighted that the number of companies per capita hurts the likelihood of belonging to Cluster 1. In contrast, a higher proportion of employees in the logistics and accommodation sectors positively affects the probability of affiliation with this cluster. Conversely, within Cluster 2, a higher concentration of employees in logistics and accommodation sectors results in a negative impact. In contrast, a greater presence of employees in financial and insurance activities shows a positive association. Regarding Cluster 3, the number of companies per capita, alongside the proportion of employees in manufacturing industries and logistics and accommodation, positively influences the probability of belonging to this cluster. In Cluster 4, company density has a negative influence, while the proportion of employees in the logistics and accommodation sectors exerts a stronger influence than Clusters 1 and 3.
Discussion
The results highlight the variability in employment growth rates between growth and recession phases across Colombia's different cities and metropolitan areas. Four distinct clusters with differentiated behaviors during recessions were identified. However, an analysis of the duration of recessions and the cities and metropolitan areas within these clusters reveals a tendency toward national synchronization. Clusters 1 and 3, including most cities, exhibit longer recession durations than the other clusters. This suggests a similar pattern of behavior among cities and metropolitan areas during recessions and expansions despite different growth rates in each phase. This indicates that recessions have a generalized national impact, with brief exceptions during the analyzed period, likely due to the centralized nature of Colombia's economic and fiscal policies, which are uniform and not tailored to local specificities. Nevertheless, differences in growth rates during recession and expansion periods reflect the significant influence of each city or metropolitan area's specific economic characteristics, such as sectoral composition and business density, on their capacity for recovery and growth.
Given these findings, it is evident that there is a need for policies that balance employment growth dynamics across the country. Therefore, we propose some recommendations aimed at addressing regional disparities in employment growth and enhancing the economic resilience of cities and metropolitan areas during recessions and expansions
Policy approaches for urban employment growth
According to the results of the 2023 Departmental Competitiveness Index of Colombia (Cheyne García, et al., 2023), reducing the asymmetry between different territorial entities requires initiatives focused on improving productivity in the country. This increase in productivity should lead to greater demand for labor and improved wages (OECD, 2022). In the results section of this document, we found that cities with better job quality exhibit less volatility in their growth rates. Therefore, it is crucial to implement measures that promote regional competitiveness and attract investment in quality, stable employment through domestic or foreign entrepreneurship or investment.
Measures to improve the labor market across regions include employment incentives for marginalized groups, as implemented by the District Secretary of Economic Development of Bogotá; financial support for entrepreneurs provided by the Government of Quindío; and technical and financial assistance offered by the Chamber of Commerce of Huila (Cheyne García, et al., 2023). Although these regional initiatives are commendable, they often depend on the priorities of the officials in office, making their continuity uncertain. Although these regional initiatives are commendable, they often depend on the priorities of the officials in office, making their continuity uncertain. To ensure a more long-term impact and prevent widening employment disparities between cities, it is essential to implement national policies that promote job growth and reduce the high level of informality. A critical strategy is to continue decreasing non-wage costs, as was done in the 2012 tax reform, which reduced taxes on companies and encouraged short-term employment generation (Fedesarrollo & ACRIP, 2014). This was complemented by Law 2010 of 2019, which decreased income taxation and encouraged investment by reducing the cost of capital (Farné, 2020).
Additionally, policies should leverage the demographic dividend of Venezuelan immigration (Miranda & Cienfuegos, 2022), as this population has a higher percentage of economically active individuals than the Colombian population (OECD, 2022). For instance, policies could prioritize the settlement of this population in cities with older populations, such as those in the coffee-growing axis (CONPES, 2014). Closing gender gaps in cities is also essential to promote formality and female participation in employment. In September 2021, the labor participation rate was 73.9% for men compared to 55.4% for women (OECD, 2022). Programs like Manzanas del Cuidado, which supports women, traditionally home caregivers, to access quality jobs, could be replicated in other cities. This program allows women to spend more time in stable jobs and less time in precarious ones, providing greater labor flexibility (Buitrago & Del Busto, 2023).
Finally, an indirect strategy for the employment generation could involve granting greater fiscal autonomy to each city and department in the country. Colombia has operated as a centralist state since adopting the 1886 constitution (Soto, 2003). The 1991 constitution provided legal tools for the state to delegate tax setting and collection to subnational entities. Fiscal decentralization measures implemented in the early 1990s led to a significant increase in regional deficits by the mid-1990s (Iregui Bohorquez et al., 2001), culminating in a crisis and a generalized slowdown by the end of the decade (Bonet, 2004). Although the Organic Law of Territorial Ordering (1454 of 2011) helped clarify competencies, in 2012, subnational entities' tax revenues only represented 28.5% of the total (OECD/UGLG, 2016). Many state transfers are inflexible in resource management due to specific destination requirements (Iregui Bohorquez et al., 2001). Therefore, many cities and departments lack the resources and competitive policies that could arise from greater fiscal autonomy. This underscores the importance of the academic and political discussion on fiscal autonomy, which has gained popularity among both politicians (DNP, 2023) and academics (Estupiñan Achury, 2018) (OECD, 2019).
Conclusions
We utilized a Markov panel regime-switching model to analyze the growth rates of 23 cities and metropolitan areas in Colombia. This methodology allowed us to identify the average expected growth rates for recession and expansion cycles, highlighting significant heterogeneity in the observed rates. During expansions, growth rates peaked at 2.6%, while in recession periods, they fell to -0.96%. The analysis reveals that cities with a higher proportion of their population employed in logistics and accommodation activities show greater resilience during economic downturns. Conversely, cities with high employment rates in manufacturing industries experience less volatile growth rates during recessions and contractions.
Four distinct clusters of cities were identified, one existing before the Covid-19 pandemic and three emerging subsequently. While two of these clusters show geographic continuity, they are coincidental as they correspond to cities rather than subnational units. Throughout the study period, the behavior of these clusters during previous national crises, such as the Great Recession of 2008 and the Covid-19 pandemic, was analyzed. In both cases, a national recession was followed by a subset of cities emerging first from the downturn. Notably, it was only after the Covid-19 pandemic that a period of national expansion was observed.
It is crucial to implement measures that promote regional competitiveness and attract investment in quality and stable jobs, whether through entrepreneurship or domestic and foreign investment. Examples include incentives to promote employment among populations facing labor market barriers, programs to enhance productivity and innovation skills in entrepreneurship, financial support for entrepreneurship, and technical and financial assistance provided by various entities. Additionally, national policies should promote job growth and reduce high levels of informality in cities. Effective strategies include reducing non-wage costs and leveraging the demographic dividend of Venezuelan immigration. Finally, greater fiscal autonomy for each city and department should be considered to promote competitive policies and ensure sufficient resources for local management.
The obtained results serve as the groundwork for future investigations, aiming to explore the specific characteristics of cities that exhibit greater dynamism during economic growth and those that demonstrate greater resilience during periods of contraction. We briefly describe some of these characteristics, but it is essential to acknowledge that other aspects may be involved. This comprehensive understanding could enable the identification of characteristics or strategies employed by these cities, allowing governments to replicate them in applicable cities and sectors. Furthermore, certain cities can more effectively recover from national recessions than others. The limited literature on regional spreads emphasizes the necessity of investigating the spread of recessions with additional covariates; this highlights the importance of further research to comprehend the dynamics of economic fluctuations at a regional level.