
10.12804/revistas.urosario.edu.co/economia/a.14711
Martha López 1
Eduardo Sarmiento Gómez 2
* We thank for valuable suggestions of Peter Ireland, Paul Soto, an anonymous referee, as well as seminar participants at the 2023 Annual Meeting of the Latin American and Caribbean Economic Association, lacea.
1 Banco de la República,
![]() mlopezpi@banrep.gov.co
mlopezpi@banrep.gov.co
2 Escuela Colombiana de Ingeniería,
![]() eduardo.sarmientog@ escuelaing.edu.co
eduardo.sarmientog@ escuelaing.edu.co
(corresponding author).
Received: October 8, 2023
Accepted: February 26, 2024
To reference this article: López, M., & Sarmiento Gómez, E. (2023). Excess asset returns predictability in an emerging economy: The case of Colombia. Revista de Economía del Rosario, 26(2), 1-29. https://doi.org/10.12804/revistas.urosario.edu.co/economia/a.14711
Abstract
The study examines the predictive capacity of book-to-market and earnings-to-price ratios in forecasting excess asset returns in an emerging market economy like Colombia's. The objective is to determine the magnitude in which these ratios help to forecast excess returns and if there is any evidence that one of the ratios outperforms the other. Furthermore, the study addresses the impact of the spread between the domestic and the foreign policy interest rate in the excess asset returns. Using Bayesian techniques, the findings suggest that the magnitude of the effect is similar for both ratios and that the impact is slightly higher in the case of firms with higher book-to-market ratios. Moreover, the study identifies evidence that the spread of interest rates explains the excess returns in a way according to the Uncovered Interest Parity theory.
Keywords: Book-to-market; earnings-to-price; excess returns; Bayesian.
JEL classification: G12; G17; C11; C15
Resumen
El estudio analiza en qué medida las relaciones de book-to-market y de ganancia-a-precio tienen poder predictivo de los excesos de retorno en una economía emergente como la colombiana. El objetivo del documento es responder cuál es la magnitud en que estas relaciones ayudan a pronosticar los excesos de retorno y si hay alguna evidencia de que una sea mayor que la otra. Adicionalmente, se pretende analizar cuál es el impacto del diferencial de tasas de interés de política doméstica y externa sobre los excesos de retorno. Mediante técnicas Bayesianas, se encuentra que la magnitud del efecto es similar para las dos relaciones y que el impacto es un poco mayor en el caso de firmas con razón de book-to-market más alta. Más aún, se encuentra evidencia que el diferencial de tasas de interés explica los excesos de retorno en línea con las predicciones de la teoría de Paridad No-Cubierta de Intereses.
Palabras clave: book-to-market; ganancia-a-precio; exceso de retornos; Bayesiano.
Clasificación JEL: G12; G17; C11; C15
Resumo
Neste artigo, analisa-se até que ponto as relações book-to-market e lucro por preço têm capacidade de prever os excessos de retorno em uma economia emergente como a Colômbia. O objetivo do artigo é responder qual é a magnitude em que essas relações ajudam a prever o excesso de retornos e se há alguma evidência de que uma é maior do que a outra. Além disso, este estudo pretende analisar o impacto do diferencial da taxa de juros da política interna e externa sobre os excessos de retorno. Usando técnicas bayesianas, constata-se que a magnitude do efeito é semelhante para as duas relações e que o impacto é um pouco maior para empresas com índices book-to-market mais altos. Além disso, há evidências de que o diferencial da taxa de juros explica o excesso de retorno de acordo com as previsões da teoria da paridade coberta da taxa de juros.
Palavras-chave: book-to-market; lucro por preço; excessos de retorno; bayesiano.
Classificação JEL: F10, F13, F14
Introduction
Forecasting stock returns has a long history. Evidence has shown that they are predictable. Asset allocation improves with the real-time forecast of stock returns which enhances investment performance. Recently, given that the world has faced an environment of high inflation rates and this has come hand in hand with very volatile stock markets, the interest in the predictability of stock returns has revived. In countries with highly developed stock markets, the analysis has been widely documented, nonetheless, in emerging markets countries the evidence is scarce. In these economies, asset returns fluctuate more than in developed economies, which makes it harder to find their economic determinants. We investigate if, like in developed economies, the earnings-to-price and book-to-market ratios remain the main drivers of excess asset returns, in the context of an emerging market economy like Colombia's. Moreover, we analyze if the evidence supports some findings that in advanced economies the book-to-market ratio outperforms other determinants as the earnings-to-price one. In light that Colombia is a small open economy, we also contribute to the empirical literature by studying if there is evidence regarding the impact of the spread between the domestic and the foreign policy interest rate as another factor, given its relationship with the expected exchange rate devaluation.
To answer these questions an empirical shortcoming is the lack of long time series data on the asset market variables for the case of Colombia. In addition, the Colombian financial system is mainly bank-based. The 25 enterprises considered in the dataset are almost the total of firms currently trading in the stock market. Given the lack of availability of long time series and cross-section data, the dataset contains annual information from 2015 to 2022. Furthermore, the Colombian stock market has frequent entry and exit of companies and some of them remain less than 10 years. This rotation means that the companies of the stock market differ if considered for a long period. To overcome this empirical shortcoming, the study used Bayesian econometric techniques, which are appropriate for panel data of small samples.
The analysis yields the following robust results. First, even though excess asset returns fluctuate considerably in Colombia, in line with the findings of Kothari and Shanken (1997) for the United States, we find a positive and economically meaningful incidence of the book-to-market ratio on excess asset returns in the Colombian economy. The evidence shows that a standard deviation in the book-to-market ratio translates into an increase of the excess returns of nearly 1.5 %. Second, a standard deviation increase in the earnings-to-price ratio also increases excess asset returns by about 1.5 % These two facts mean that the book-to-market ratio does not outperform the earnings-to-price ratio in explaining excess asset returns in Colombia or the other way around. Finally, an important finding of this study is that in an emerging market economy like Colombia's, the spread is another economic factor explaining excess asset returns; an increase of one p. p. (percentage point) in the spread translates into a decrease of about 1.9 p. p. in the expected excess returns.
The results hold after a variety of robustness checks. We re-run the main specification for different subsamples, one for firms with a high book-to-market ratio and one with a low book-to-market ratio. We also modify the main specification by altering the choice of the prior distributions of the parameters of the book-to-market and earnings-to-price ratios: the standard deviation of the baseline gamma distribution and the choice of a normal distribution instead of a gamma distribution.
The paper is structured as follows: Section 2 discusses the related literature. Section 3 describes the data and econometric strategy. Section 4 presents the results. Section 5 presents three robustness exercises. Finally, section 6 offers the conclusions from the study.
Related Literature
As mentioned in the introduction, forecasting stock returns has a long history. Its study dates back to Cowles (1933) and other seminal papers like the ones by Fama and Schwert (1977), and Campbell and Shiller (1988). The main variables used to predict returns are book-to-market, dividend yields, and earnings-to-price. The book-to-market incidence over excess returns is expected to be positive since it increases when stocks are cheap with respect to the book value. An expansion in dividend yields increases the value of the firm raising excess returns and earnings-to-price is an indicator used by investors to buy and sell stocks, buying when it is higher and selling when it becomes lower.
This paper contributes to various strands of literature. First, to the literature on the most prominent financial factors that predict excess returns by showing that in emerging markets economies, variables of profitability, such as earnings-to-price ratio, also have predictive power on excess asset returns. Fama and French (1988), using value and equal-weighted portfolios of the New York Stock Exchange during 1927-1986, provide evidence of the relationship between dividend yields on expected returns with a slope increasing with the time horizon from one month, one quarter, and one to four years. Campbell and Shiller (1988) present evidence showing that data on earnings help to predict exact returns and discounted returns. These authors, using extended annual data from 1871-1987 in the United States, find a significant relationship between stock returns with lagged dividend-to-price, lagged earnings-to-price, and a moving average of earnings-to-price of ten and thirty years.
Second, more recently, the predictability of stock returns has been addressed mainly in the United States and countries with well-developed stock markets. For example, Ang and Bekaert (2007) provide evidence of predictability of stock returns for France, Germany, the United Kingdom, and the United States. There are other studies for a group of developed countries, among them those by Henkel et al. (2011), Della Corte et al. (2010), Cooper and Priestly (2009) and Kellard et al. (2010). Meanwhile, determinants of asset returns in emerging markets economies remain a matter of study. In this sense, the paper contributes to filling that gap.
Third, stock returns literature uses both time series data and panel data. In the United States long-term time series data of excess returns, book-to-market, dividend-price, and earnings-to-price are available from sources such as the Dow Jones Industrial Index, the Standard & Poor Composite Stock Price Index, and the New York Stock Exchange from the Center for Research in Security Prices (CRSP). Colombian stocks price information is available from the Bogota Exchange and Medellin Exchange indexes, and from the Colcap Index for more recent data. The firm's information is available from the Colombia's Value Stock Exchange, but as mentioned in the introduction, the sample size in Colombia is minuscule. Addressing the small sample size bias of the ordinary least squares (OLS) estimates, Kothari and Shanken (1997) use a Bayesian bootstrap procedure and find a significant relation of the real stock returns with lagged book-to-market and lagged dividend-to-price for annual data between 1926 and 1991 in the United States. This document also uses Bayesian techniques to overcome the small sample bias problem and contributes to this strand of literature by showing that lagged book-to-market and lagged earnings-to-price data can predict stocks excess returns in the context of an emerging market economy like Colombia's.
Fourth, there is a debate on the relative importance of book-to-market and profitability variables to contribute to the predictability of excess asset returns. On the one hand, for example, Kothari and Shanken (1997) evaluate the ability of an aggregate book-to-market ratio to track time series variations in expected market index returns and compare its forecast ability to that of dividend yields, finding that the first outperforms the second for the whole sample period, but for a subsample between 1941 and 1991 the dividend ratio outperforms the book-to-market one. Consequently, they conclude that neither variable consistently dominates the other. On the other hand, Pontiff and Schall (1998), using monthly and annual data during 1926 and 1994, also for the United States, find that book-to-market predicts better market returns in the pre-period of 1960. Among the determinants of market returns they also consider dividend yields, with less explanatory significance. The paper contributes to this debate by finding that in an emerging market economy the earnings-to-price and the book-to-market ratios have similar predictive capacities over excess returns, but their economic significance is lower than in developed economies.
Moreover, Fama and French (1993) present a three-factor model designed to capture the relationship between average return with size and book-to-market. Later, Fama and French (2015) expanded it to a five-factor model for the United States with monthly data during 1963-2013, and besides the book-to-market ratio and size incidence on returns, the profitability and investment patterns are addressed. They find that excess returns increase in firms that are smaller in size, more profitable, higher in book-to-market and smaller in assets' growth. Regarding the book-to-market ratio, they find that if parsimony is an issue, it is a redundant factor. "But if one is also interested in portfolio tilts toward size, value, profitability, and investment premiums, the five-factor model is the choice" (p. 19). Our paper contributes by showing that in Colombia the incidence of book-to-market on excess returns is more significant in firms with higher book-to-market ratios.
Finally, in recent empirical literature, some other factors have been considered, but it is the book-to-market ratio, earnings-to-price, and dividend-to-price that remain the most important for explaining asset returns. For example, Feng et al. (2019) evaluate the determinants of asset returns from July 1976 to December 2017 in the United States, considering 150 factors and multiple portfolios, of which the most significant are the ones related to profitability. Our paper contributes to this new evidence by considering a factor that, to our knowledge, has not been used in the literature: the spread between the domestic and foreign policy interest rates. According to the Uncovered Interest Parity theory, this factor is important in a small open economy because it is related to the expected devaluation of the exchange rate, which in turn affects expected excess returns.
Bayesian Estimation
Methodology
The study applies Bayesian techniques, which are increasingly popular in the fields of macroeconomics and finance. We chose this because the Bayesian approach outperforms the Generalized Method of Moments (GMM) and Maximum Likelihood in small samples, which is an important concern for the study. This empirical approach involves obtaining the posterior distribution of the model's parameters based on its log-linear state-space representation. The posterior distribution is obtained by the combination of the likelihood function for the observed data (obtained with the help of a Kalman filter) with the selected prior distributions for each of the parameters of the model. If conjugacy is obtained by this combination, then the posterior can then be analytically optimized for the model parameters directly. Computational tools, like Monte-Carlo Markov-Chain (MCMC) sampling, should be used as we do in this study.
Formally, defining Θ as the parameter space, we wish to estimate the model parameters, denoted by θ ∈ Θ. Given a prior p(Θ), the posterior density of the model parameters, Θ, is given by.

Where L(θ│YT) is the likelihood conditional on observed data, YT. The posterior distribution is typically characterized by measures of a central location, such as the mode or the mean, and measures of dispersion, such as the standard deviation or the highest posterior density (HPD).
For the MCMC sampling, we use Gibbs sampler updates in the cases when the parameters prior distributions allowed them, and we estimated blocks.
Data and Summary of Statistics
Based on the literature preview, and our observations about the relationship between the exchange rate depreciation and the real excess returns, we aim to estimate the following equation for the Colombian stock market.
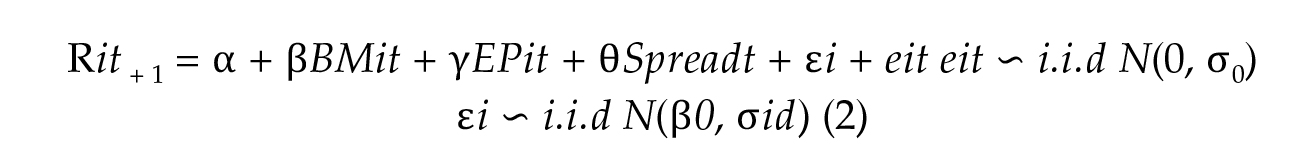
BM is the ratio of the book-to-market per share at the end of year t of the stocks in the Colombian market, divided by its standard deviation. R is the annual real excess return in year t+1 inclusive of prices and dividends discounted by the annual interest rate of the banks CDT'S. EP is the ratio of earnings in year t regarding the prices at the end of year t, divided by its standard deviation.1 In the Colombian stock market, there is a relationship between the exchange rate devaluation and the excess returns of stocks, therefore we include, as another factor in the model, the Spread between the domestic and the United States policy interest rate. The spread is a variable that explains expected exchange rate depreciation as predicted by the Uncovered Interest Parity (UIP) theory. Table 1 presents the descriptive statistics of the variables in the model
Table 1. Data and descriptive statistics
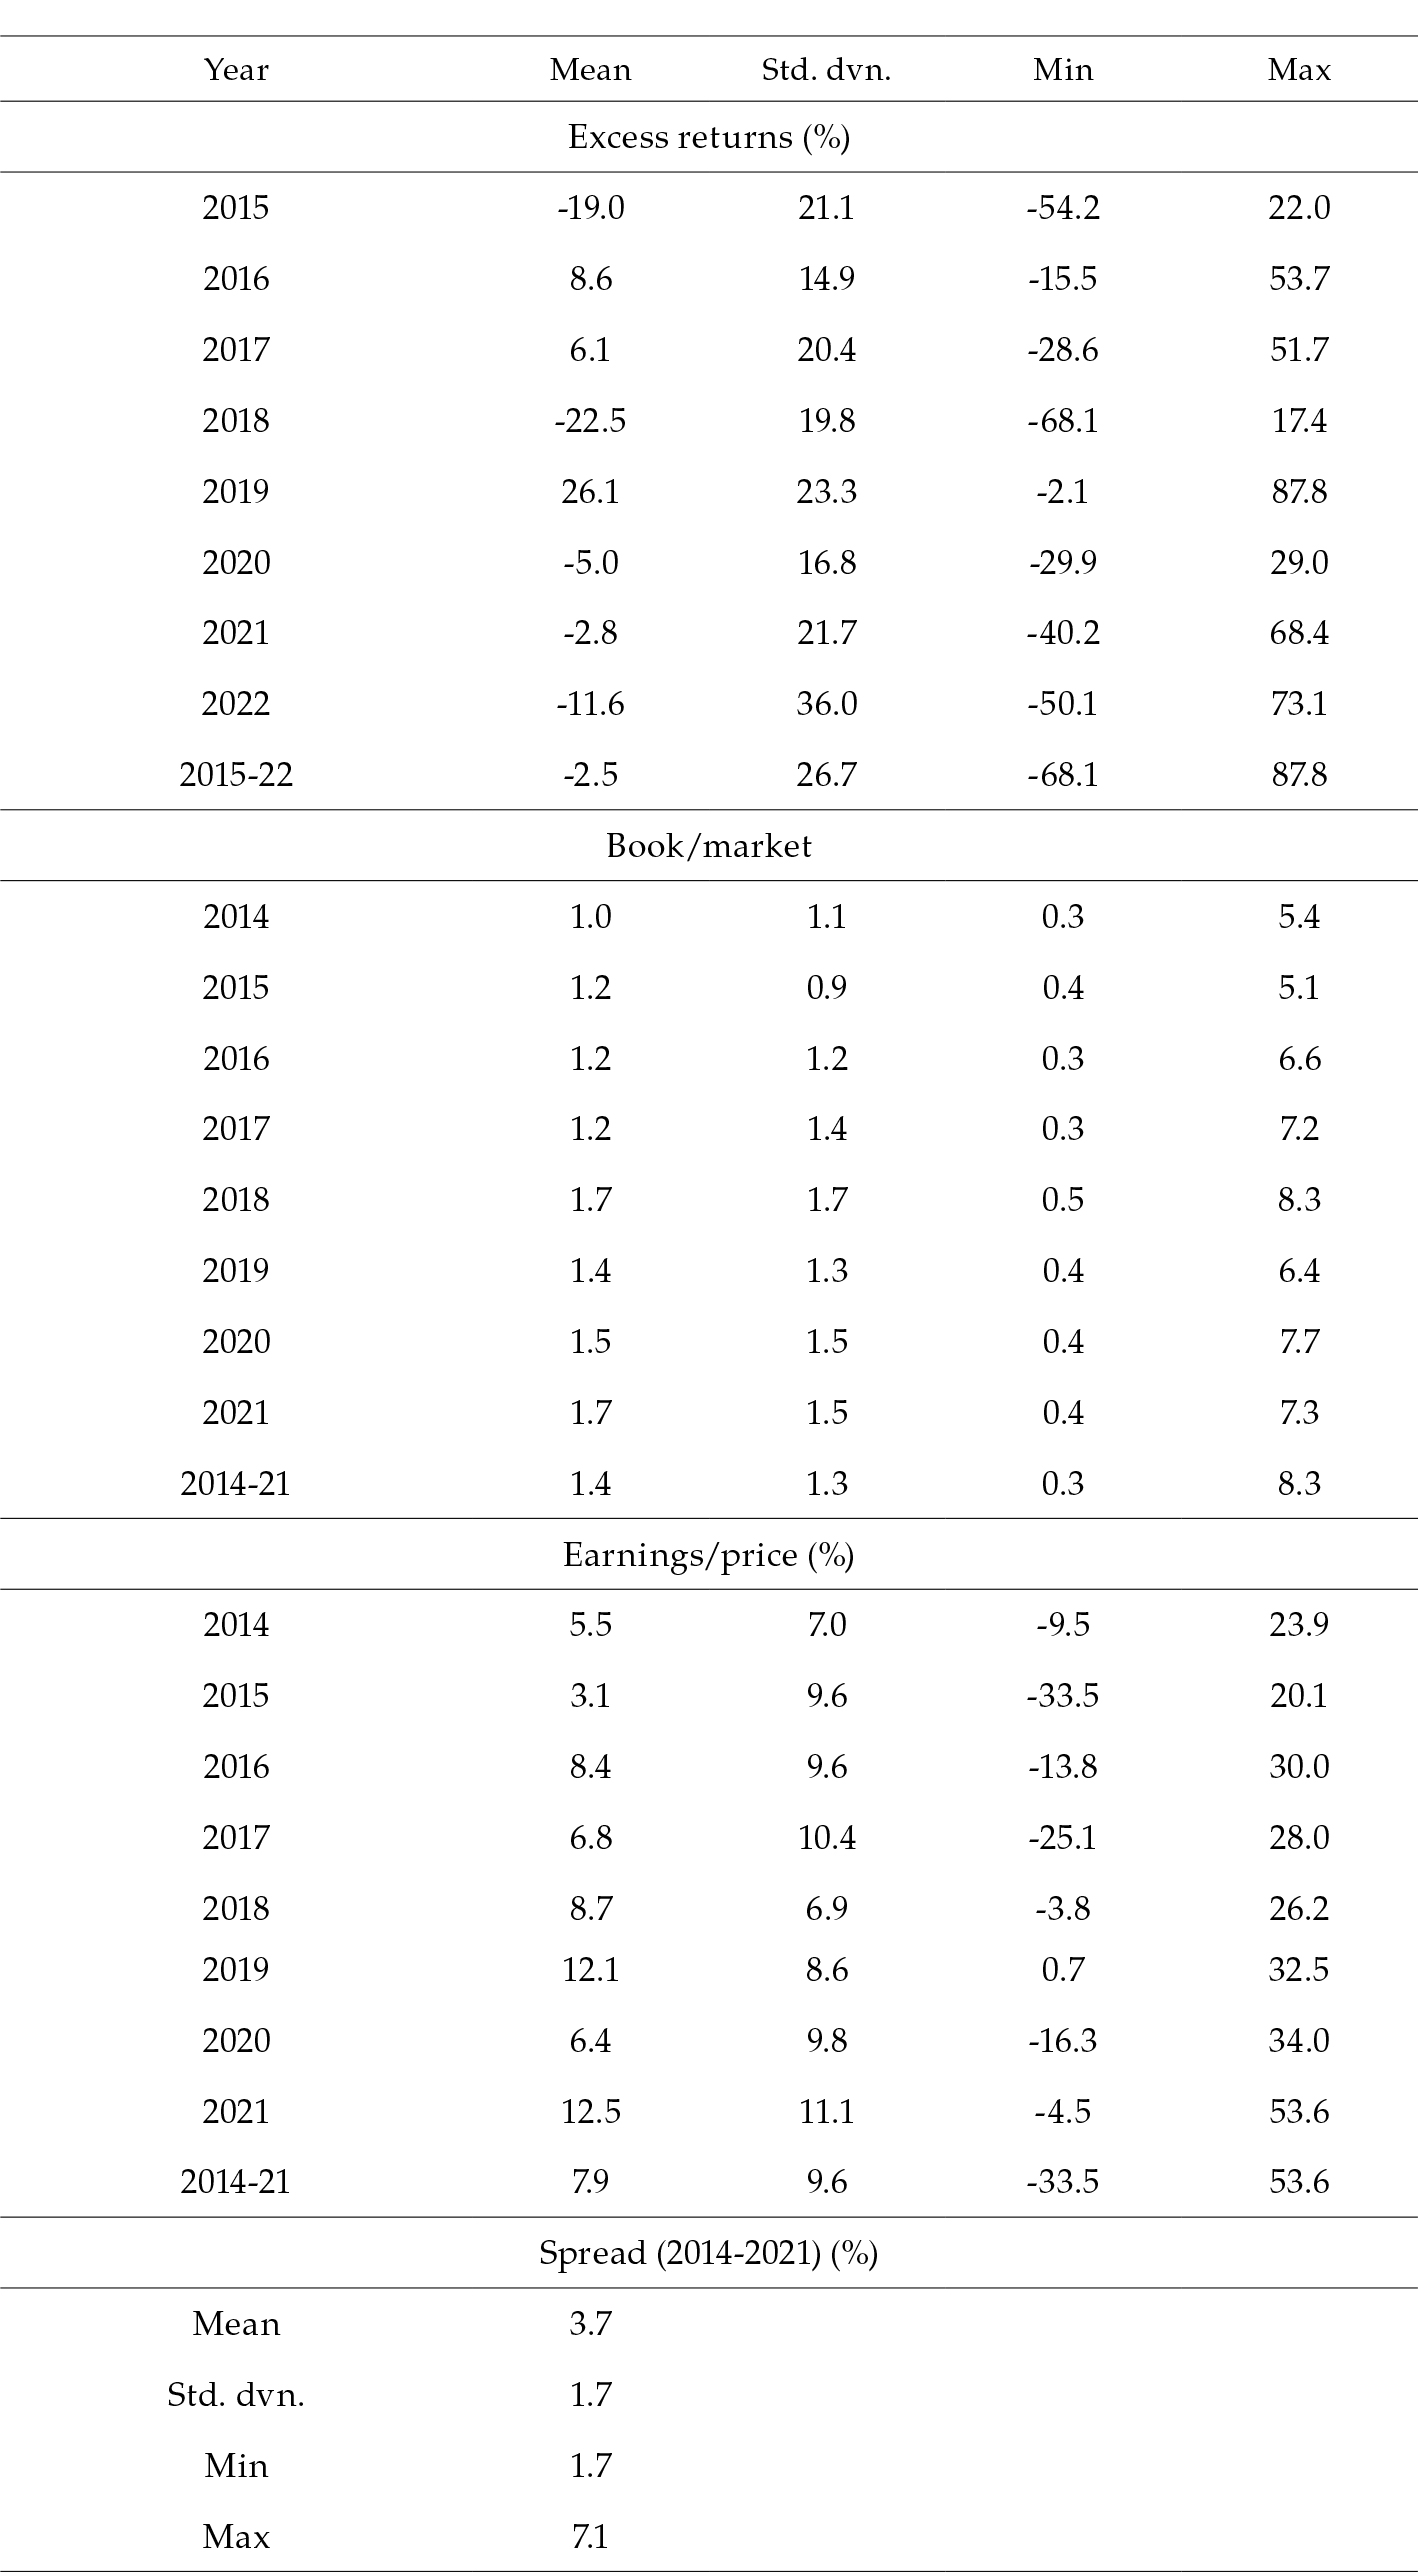
Excess returns is the anual real return in year t
inclusive of prices and dividends with respect to the risk free rate CDT'S. Book to market is the ratio of the book to market per share at the end of year t.
Earnings/price is the earnings in year t with respect to prices at the end of year t.
Spread is the difference between the policy interest rates in Colombia and United States in year t.
During 2015-2022 the excess returns in Colombia had considerable fluctuations. The highest was in 2019 with 26.1% and the lowest in 2018 with -22.5 °%. The book-to-market variations and price fluctuations went hand in hand. The book-to-market increased in 2015, 2018, 2020 and 2021, and decreased in 2019. In the period the lowest book-to-market was presented by a firm with 0.3 and the highest by a firm with 8.3. When this ratio is high the next year's excess returns become higher because of the readjustment of prices since the stocks are cheap.
The earnings-to-price mean during 2014-2021 was 7.9%. The earnings-to-price depends on the profitability of the firms and the prices' fluctuations. In the Colombian stock market, the earnings-to-price ratio depends on the trend of price variations during the past years. Firms that have a positive trend have lower earnings-to-price below 5%, and firms without a positive trend have earnings-to-price close to 10%. An increase in earnings-to-price increases the next year's excess returns through the higher prices. In the United States, the earnings-to-price ratio of dynamic high-tech stocks can be close to 2%, meanwhile, stocks without a positive trend in prices can have a ratio of 10 %. The same fact is true in Colombia depending on the stock. The spread between the policy interest rate of Colombia and the one of the United States determines the expected exchange rate devaluation according to the UIP theory. During 2014-2021 the mean spread was 3.7%, with a standard deviation of 1.7%, a maximum of 7.1%, and a minimum of 1.7%.
Priors
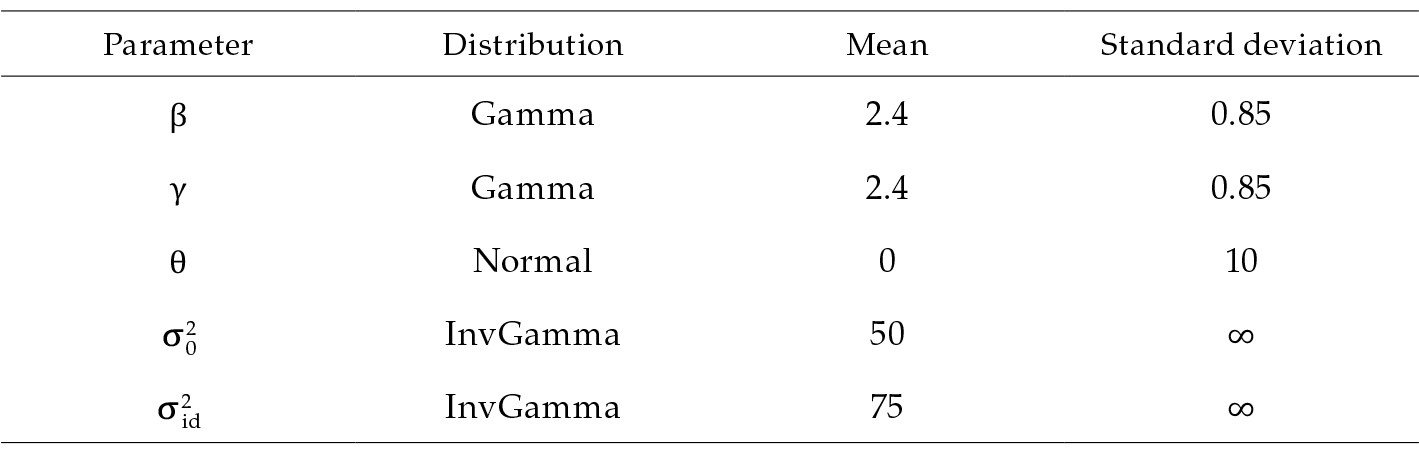
We assign the corresponding priors according to previous studies. We use gamma distributions for the variables that are restricted to positive and normal distributions for the variables for which we do not have any previous information. We use inverse-gamma distributions for the variances of the model as is common in the Bayesian literature.
For the parameter β we use previous estimates by Kothari and Shanken (1997). For y we have the estimates of Campbell and Shiller (1988), but we adjust the mean to have the same distribution of β because we want to assess if the ratio of book-to-market outperforms the earnings-to-price ratio or the other way around. For the parameter of the spread of the policy interest rate, 0, we use our own estimations and assign a normal distribution with a high variance. For  and
and  we use our own estimations. Table 2 presents the corresponding prior distributions for the parameters of the model. We use 250 000 MCMC iterations and discard the first 125000. We block the estimation of the parameters and use Gibbs sampling to improve their efficiency when the prior distribution allows doing that. The model was estimated using Stata.
Table 2. Prior distribution for the parameters of the models
Results
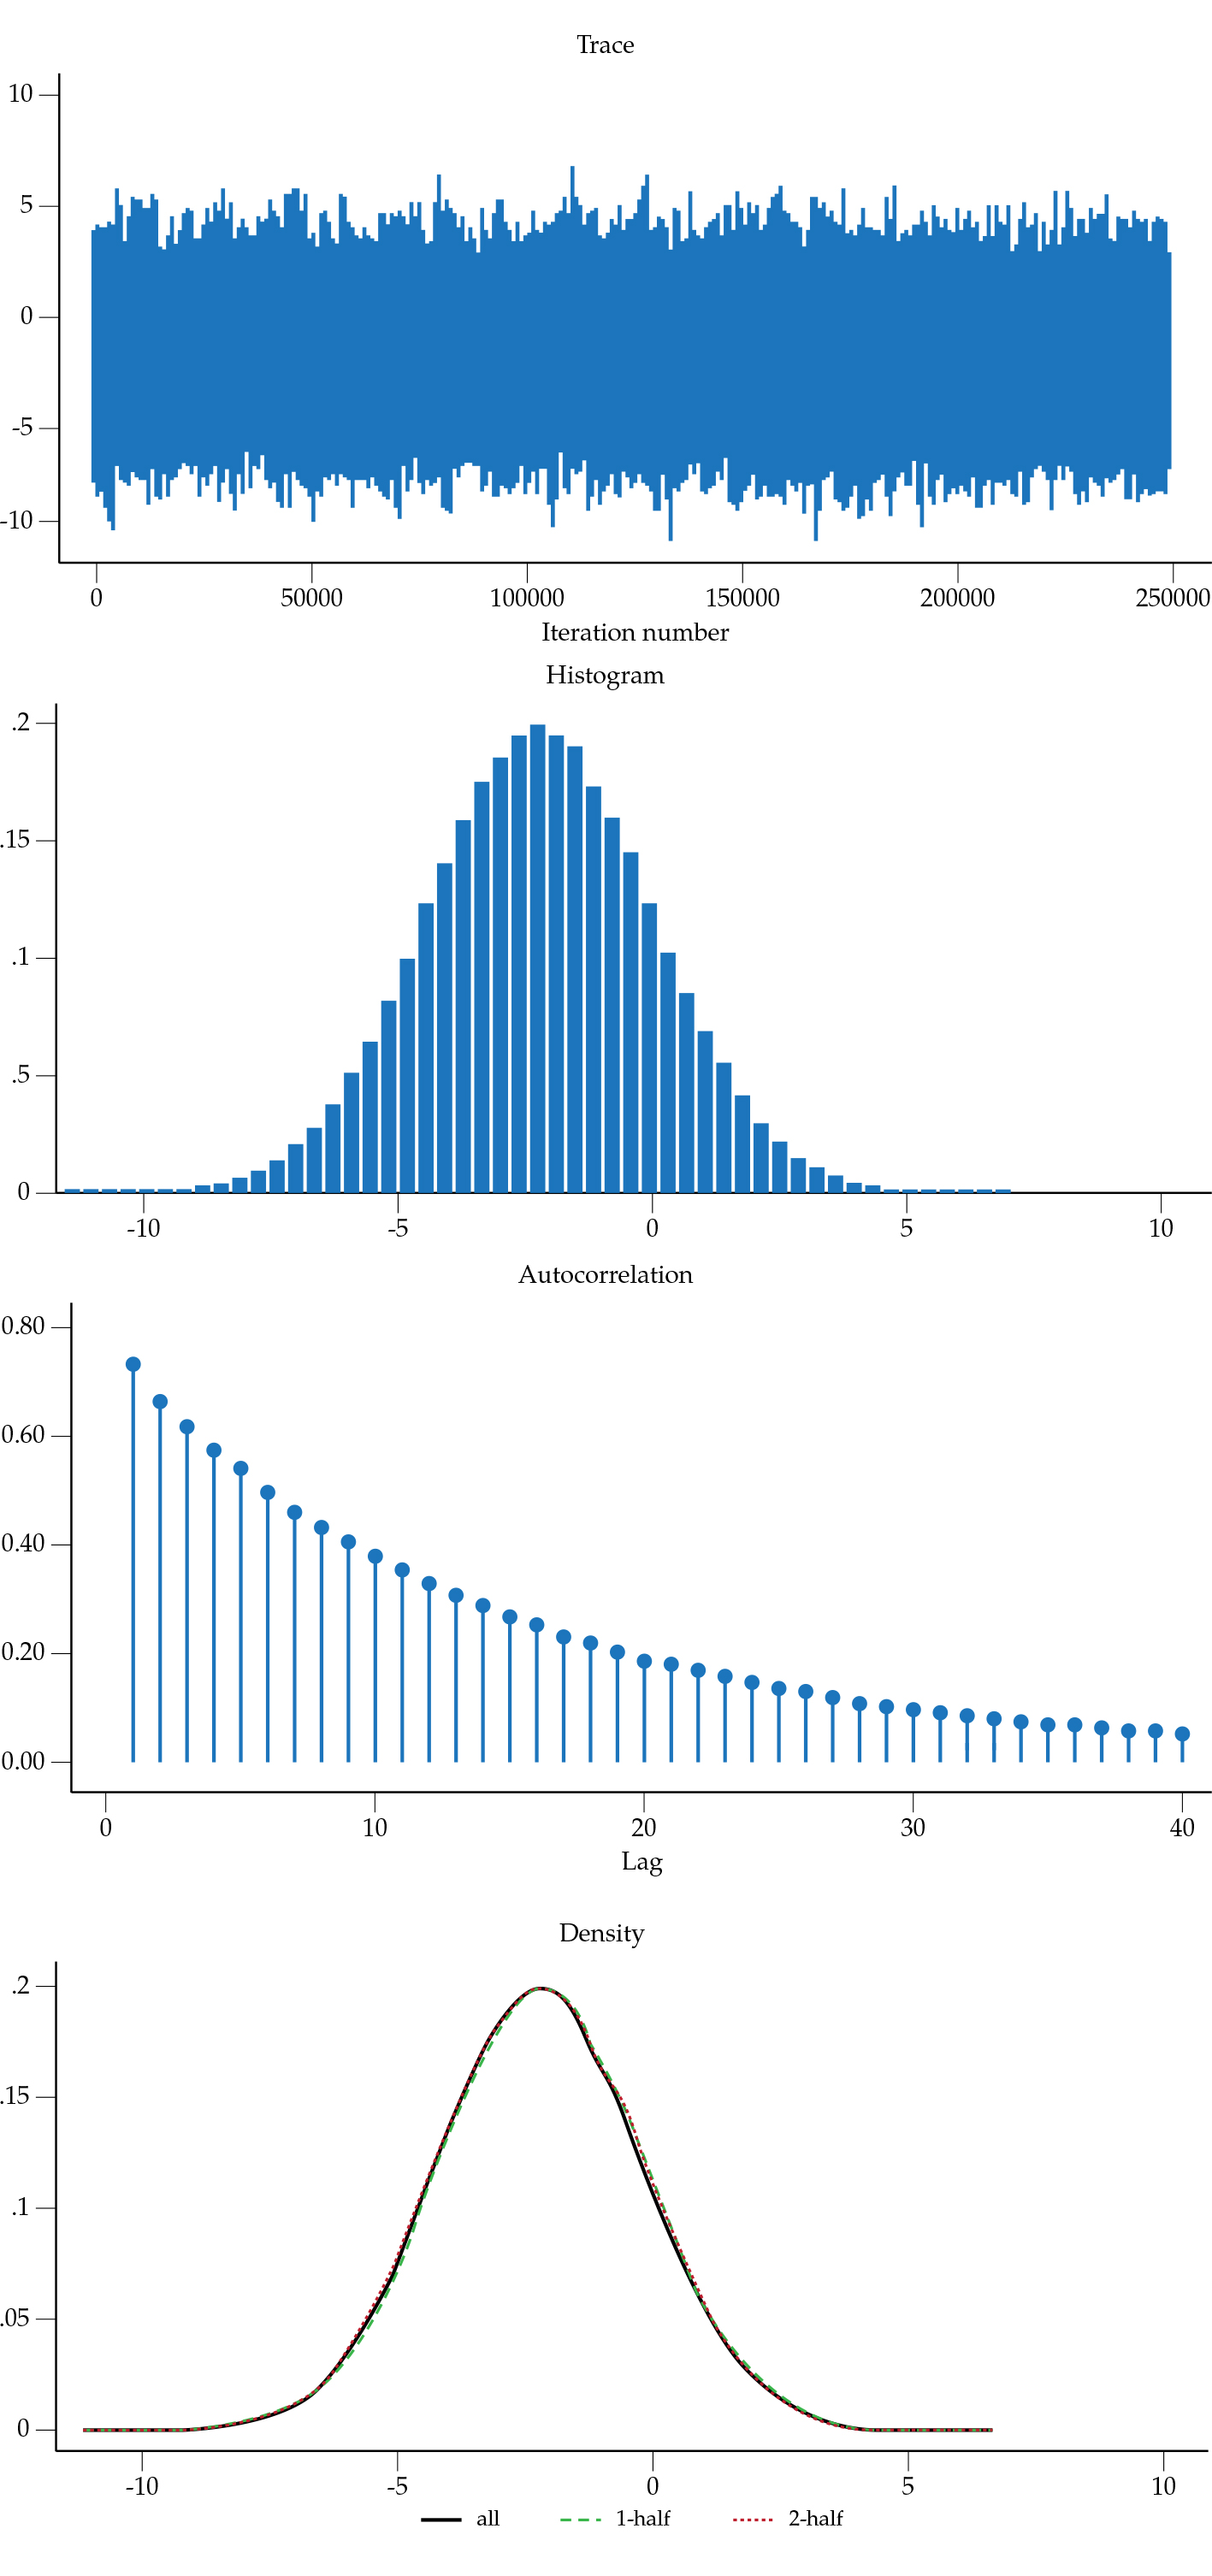
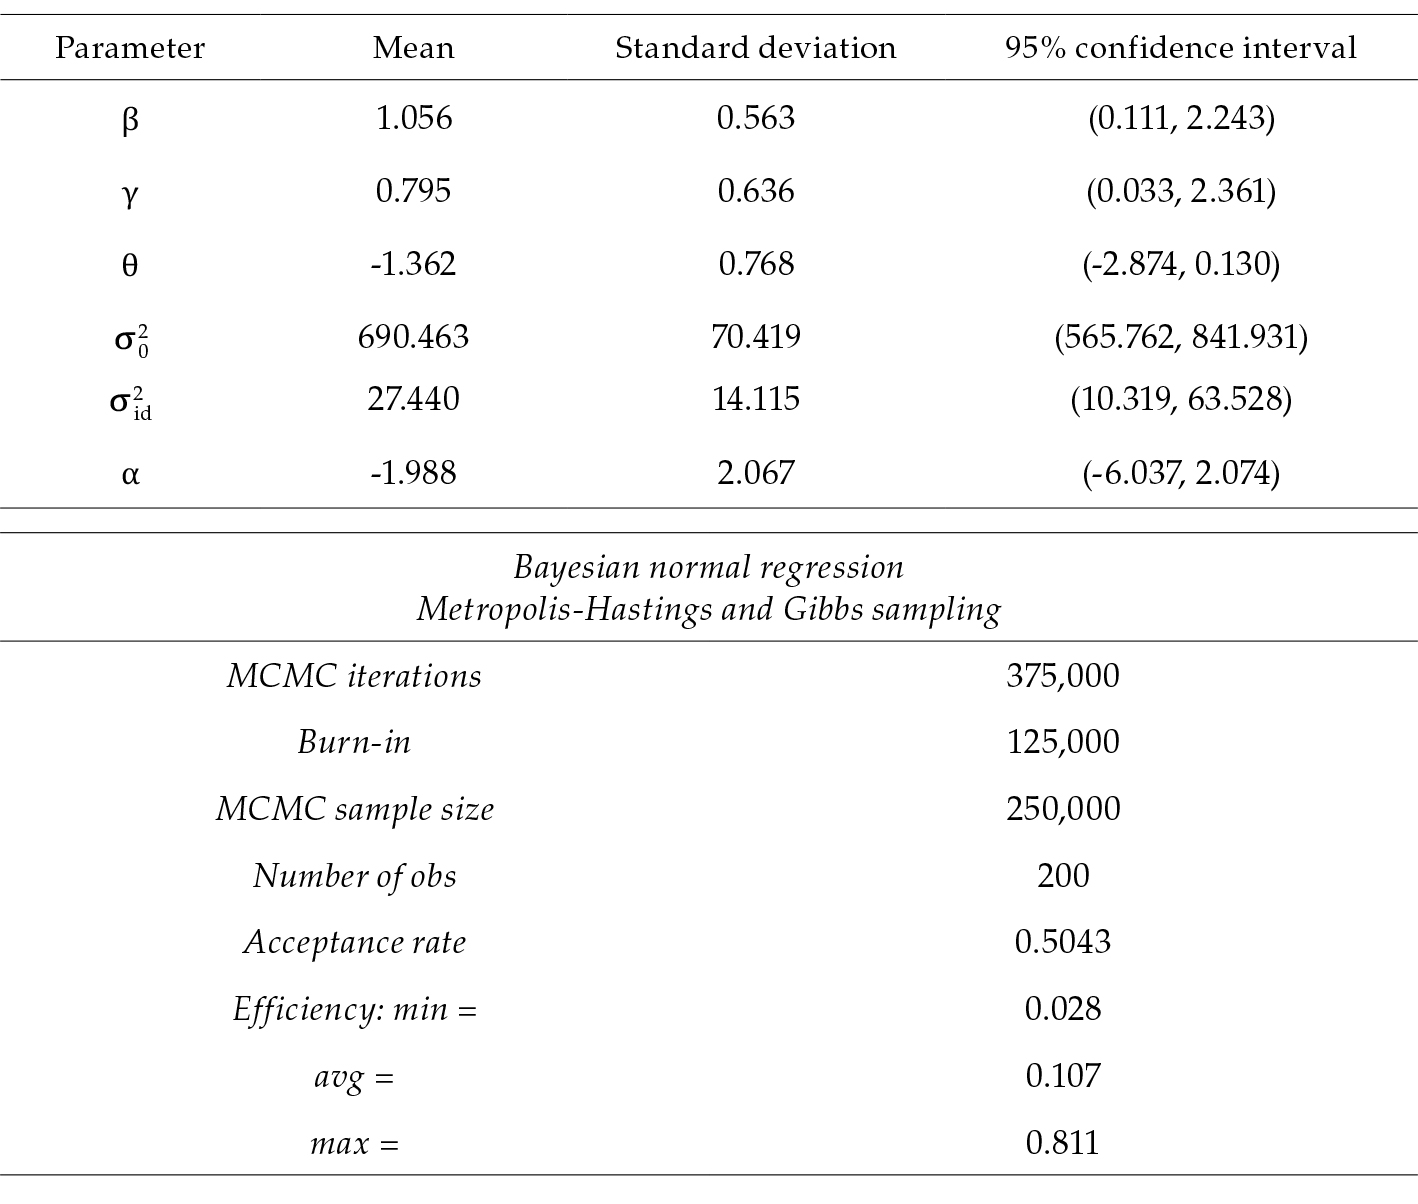
First, we analyzed the properties of the Bayesian estimation of the model, that is, the convergence of the parameter values and the goodness of fit of the model. Table 3 presents the acceptance rate of the model, 0.483, and the average efficiency, 0.1173. Both are very good diagnostics of the convergence of an MH MCMC chain according to Gelman et al. (1997). The convergence diagnostics of the individual model parameters are also appropriate as can be observed in Figures 1-6. First, for all the parameters in the model, the diagnostic of the trace2 does not show any trend that could suggest an autocorrelation of the MCMC chain. The last is confirmed by the very low autocorrelation diagnostics. As for the density functions and histograms, they are unimodal. For the parameters β and γ we also present the graph of the prior distributions to show that the data provides considerable information moving priors to posteriors.
Figure 1. Book-to-market

Figure 2. Earning to price
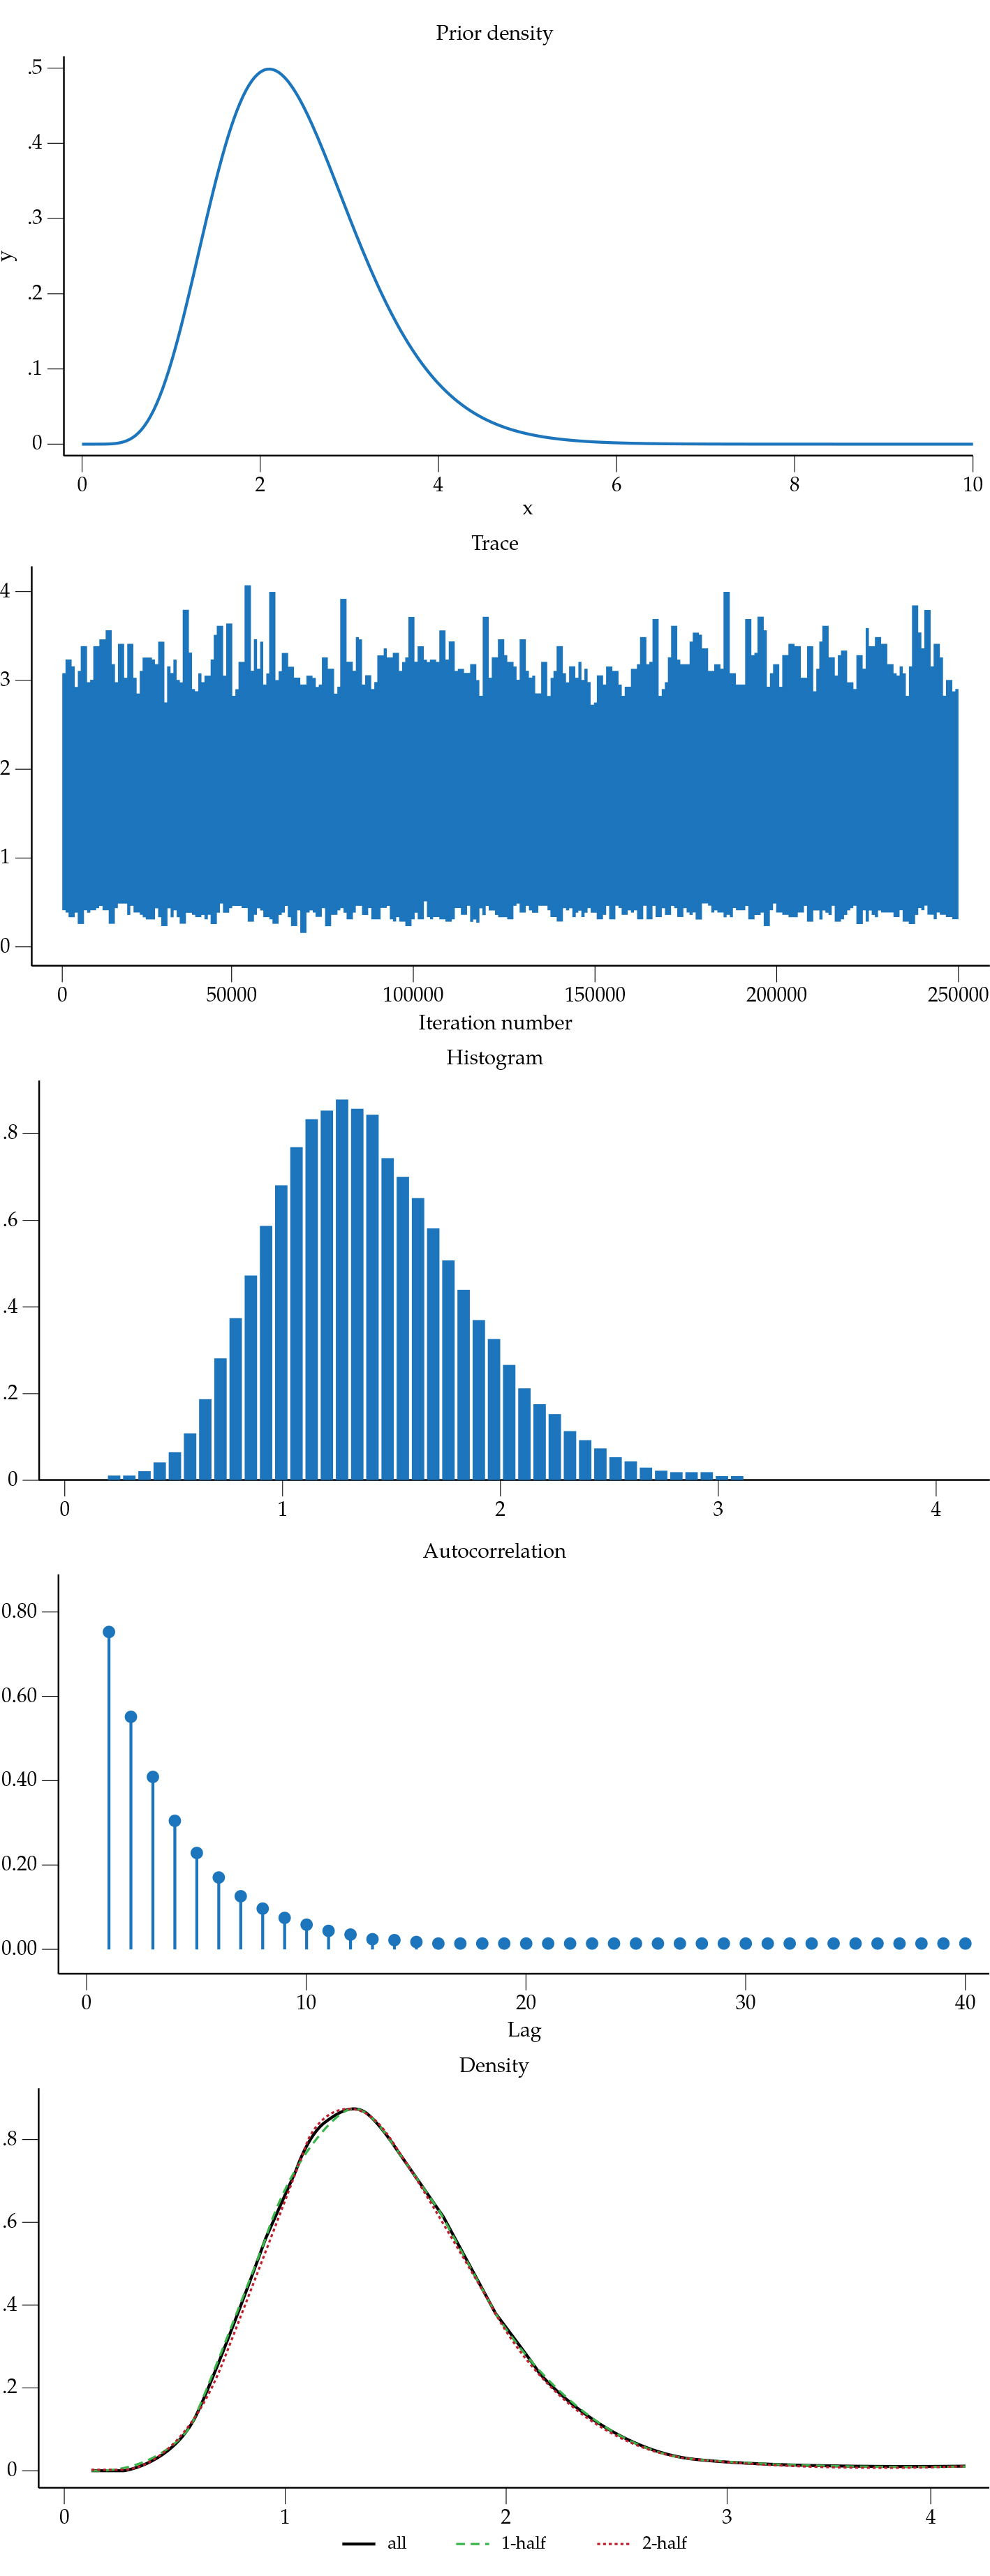
Figure 3. Interest rate spread
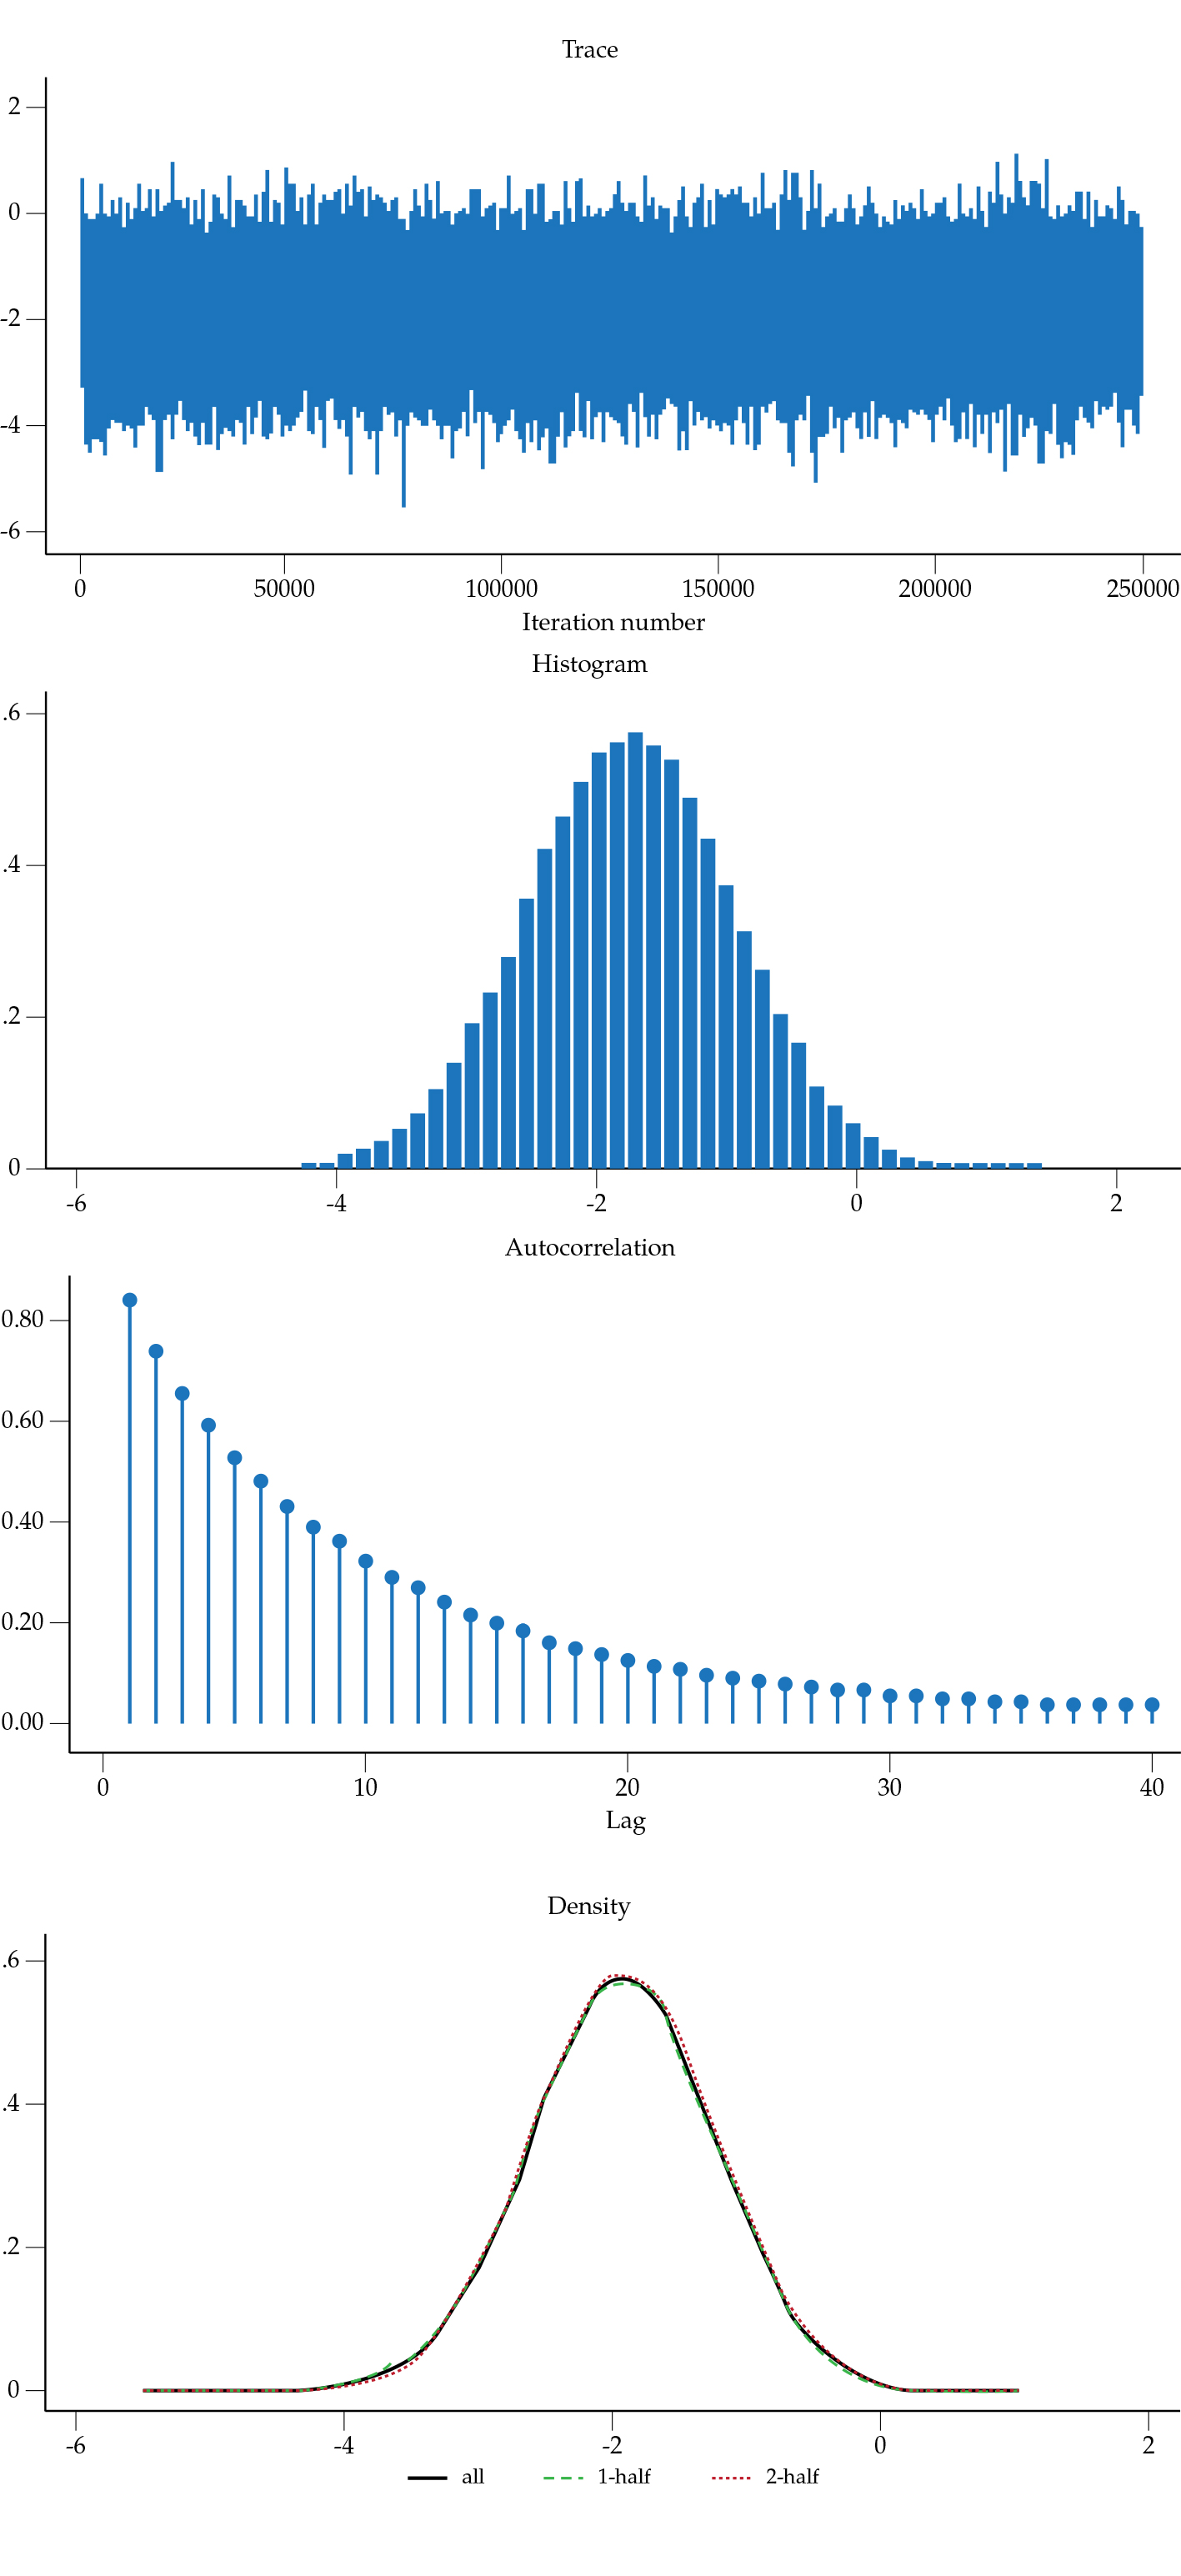
Figure 4. Model
residuals variance,
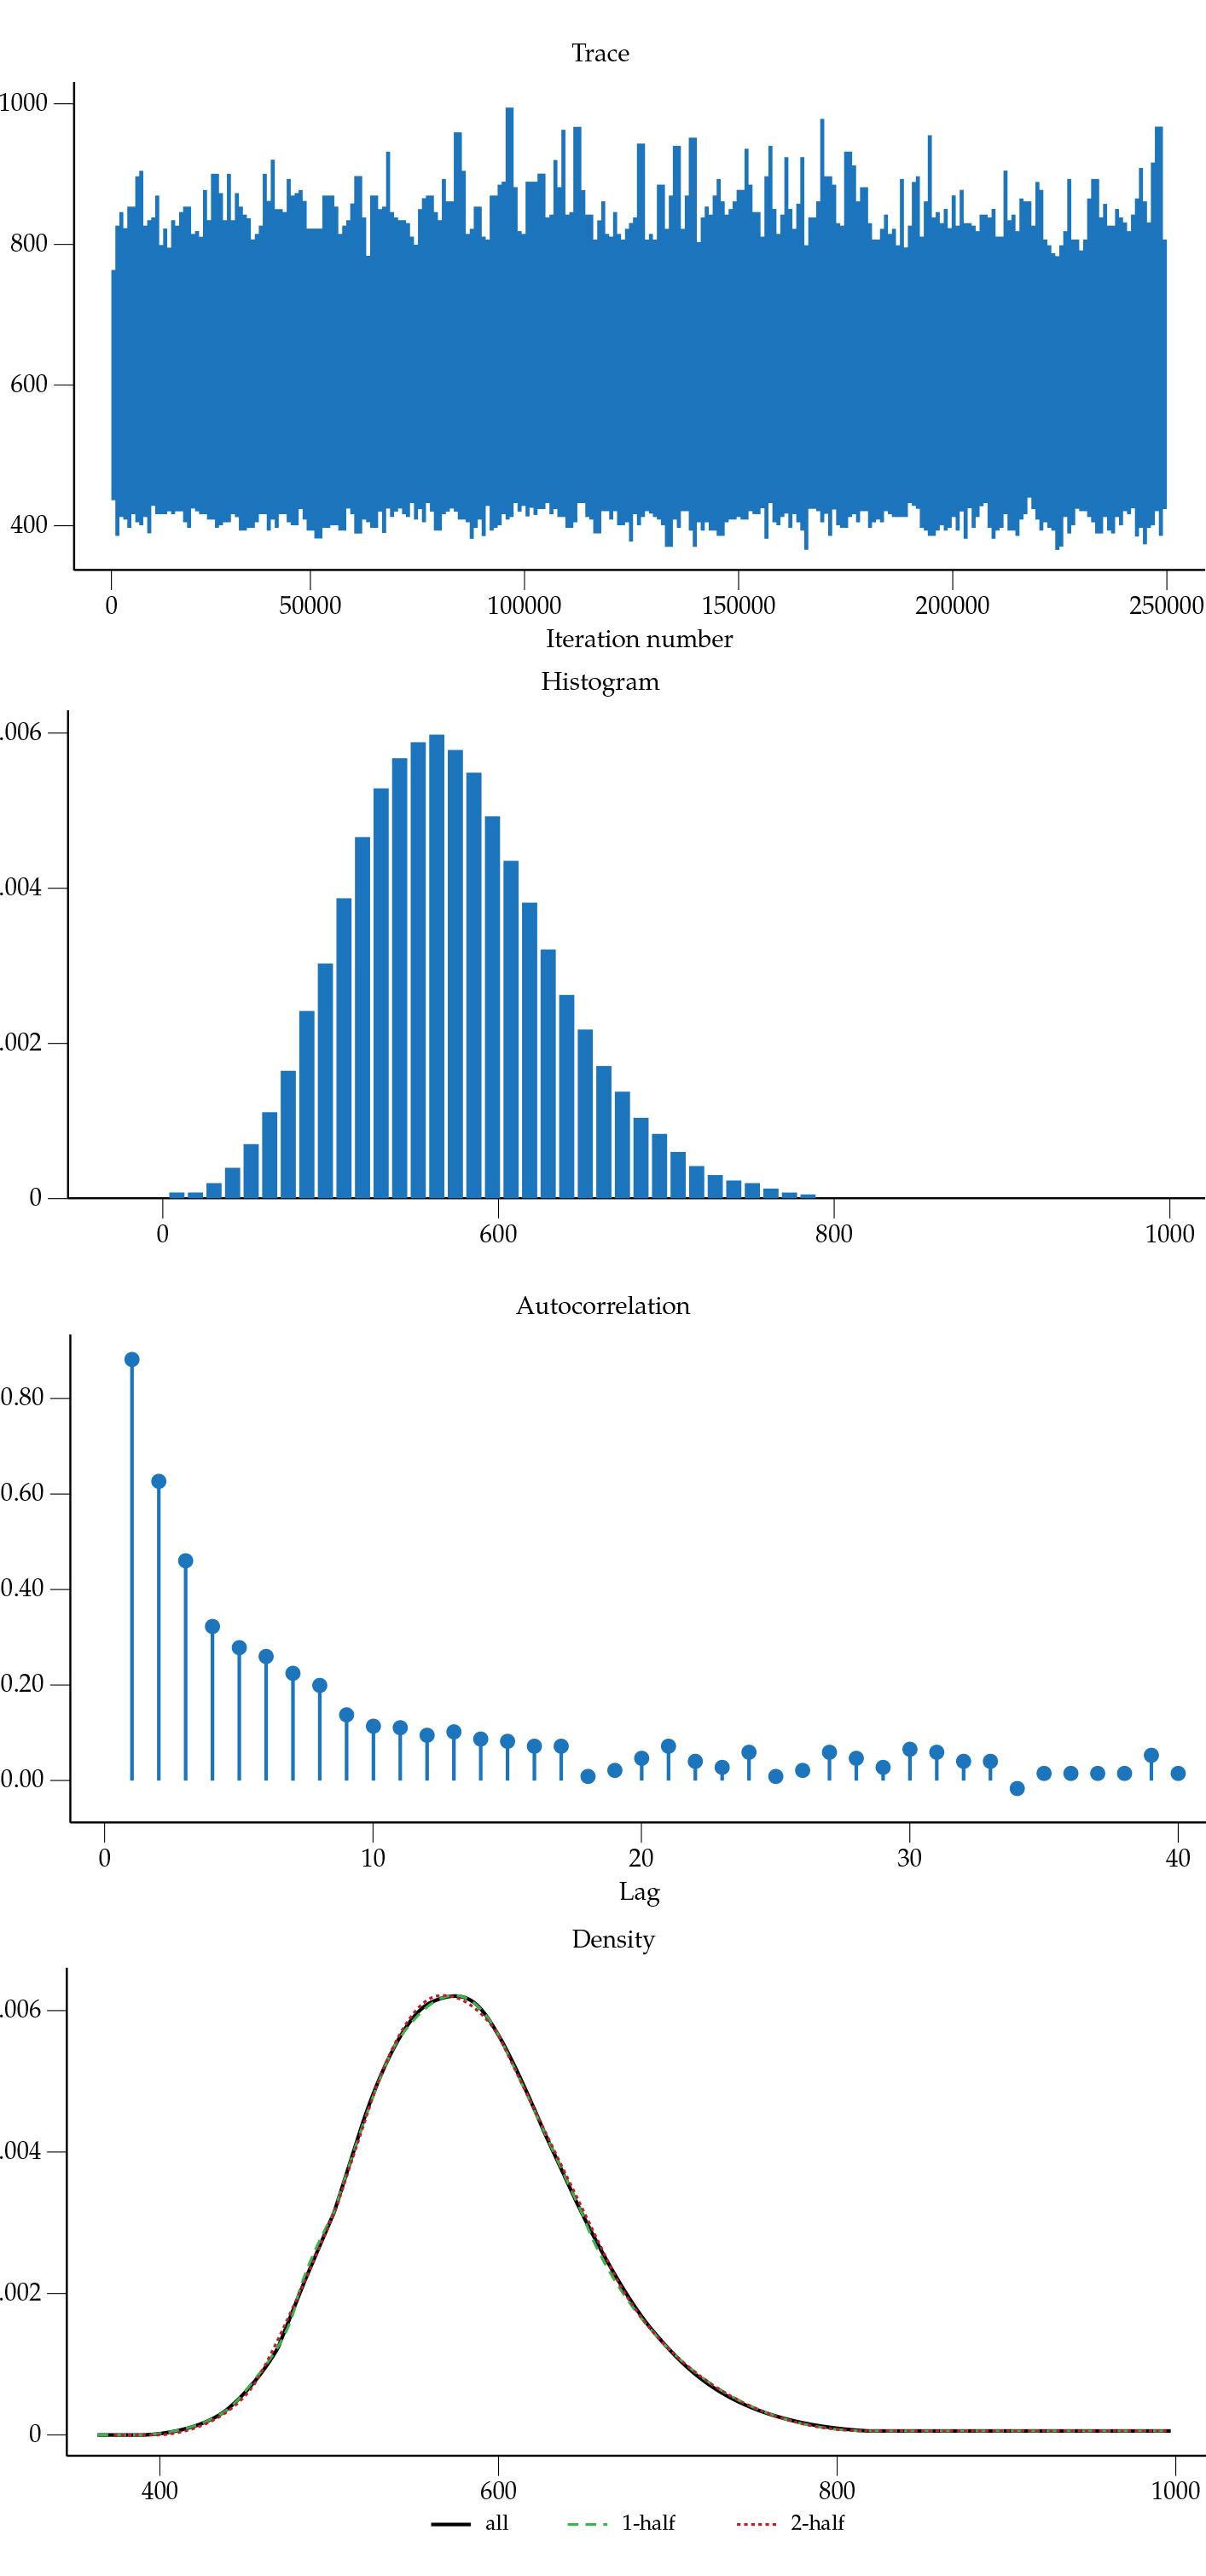
Figure 5. Firm's residuals variance,

Figure 6. Constant
For the evaluation of the model, regarding their in-sample predictions, it is expected that the posterior predictive p-values of the probability that the mean of the simulated estimations is greater or equal to the expected value of the observed outcome variable is far from cero or 1. For our model, this is the case for most of the simulations which indicates a very good fit3 (Figure 7). Moreover, concerning the model residuals,4 Tables 4 and 5 present the posterior predictive p-values of their mean and variance, respectively, which are close to 0.5 which is ideal. The posterior predicted p-values of the normality test are presented in Table 6 for the skewness and the kurtosis, which are also far from 0 or 1.
Having analyzed the diagnostics of the parameters, the model itself and its goodness of fit, we can proceed to interpret the parameters. Table 3 also presents our estimates of the parameters. The one for the book-to-market ratio has a mean of 1.458 with a credible interval between 0.746 and 2.304.
The parameter of the earnings-to-price has a mean of 1.537 with a credible interval between 0.708 and 2.634. This implies that for an increase of one standard deviation in both, the book-to-market and earnings-to-price, the excess returns increase by nearly 1.5%. These estimates imply that the ratio of book-to-market does not outperform the earnings-to-price ratio in explaining excess returns, contrary to some findings for the United States. In our estimations, the 95 % credible interval for the two variables overlaps. In section 5 we present robustness exercises for this result. However, the estimated posterior mean of the book-to-market ratio is close to 1 while for studies in the United States it is usually higher, close to 4.
Figure 7. Estimated posterior predictive p-value. Probability that the mean of the simulation of the excess returns is greater or equal to the observed excess returns

Table 3. Posterior distribution for the parameters

Table 4. Posterior predicted p-values for the mean of the simulated residuals
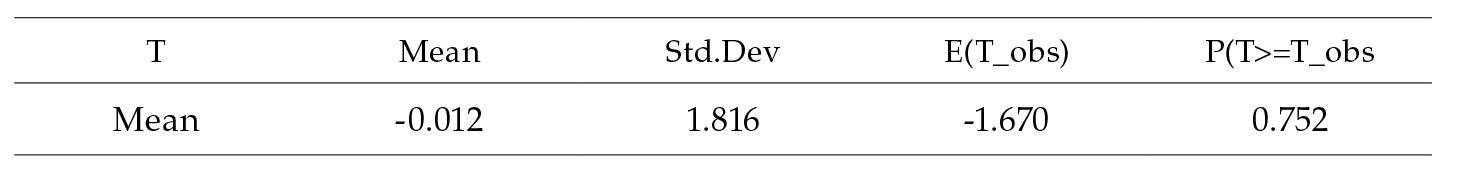
Note. (P>=T_obs) close to 0 or 1 indicates lack of fit
Table 5. Posterior predicted p-values for the variance of the simulated residuals
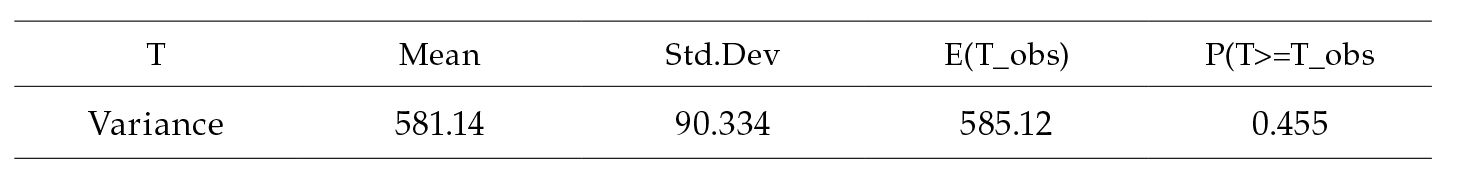
Note. (P>=T_obs) close to 0 or 1 indicates lack of fit
Table 6. Posterior predicted p-values for skewness and kurtosis of the simulated residuals
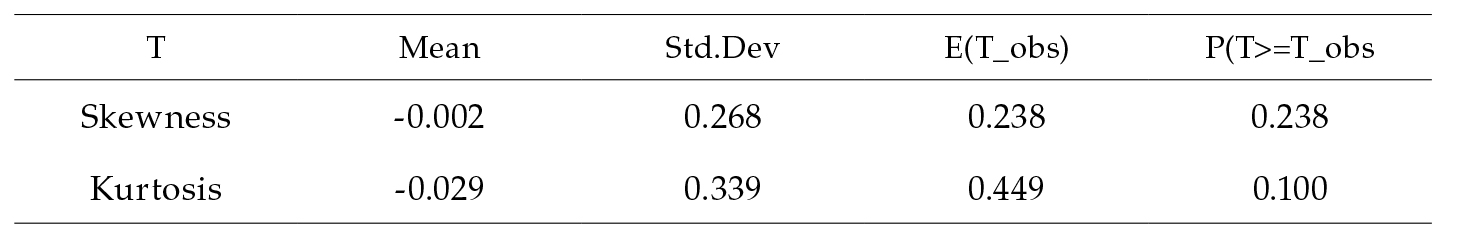
Note. (P>=T_obs) close to 0 or 1 indicates lack of fit
A very interesting result is that the parameter of the spread of the policy interest rates, θ, is negative. This means that, as expected by the UIP theory, a higher spread in time t corresponds to an expected devaluation of the exchange rate in t+1 and therefore to lower expected excess returns. An increase of 1 p.p. in the spread translates into a fall in expected excess returns of about 1.946 p.p., with a 95 % credible interval between -3.362 p.p. and -0.560 p.p.
The studies about excess returns in emerging economies are scarce which it makes difficult to compare our results to other studies different from the ones of advanced economies. However, Foye (2018) using data for 18 emerging markets by region (Asia, Eastern Europe, and Latin America), finds that in all three regions, the book-to-market factor is the only one that is not redundant out of the five factors (market, size, value, profitability, and investment). While the profitability factor indicates that there is a profitability premium in Eastern Europe and Latin America. Finally, Harvey (1994) documented that, using data from 20 developing countries, returns are predictable in 13 countries and the local variables are important in 9 countries, among which the foreign exchange rate relative to the dollar.
Robustness
To check the robustness of the results we performed three exercises.
Priors with a higher standard deviation
We increase the standard deviation for the prior gamma distribution of the β and y coefficients of the regressions. We increase this deviation from 0.85 to 2.3 and the results are presented in Table 7. The mean for these parameters is about 1 %, which is a value that is initially contained in the 95% confidence interval when we used the baseline estimation with a prior standard deviation of 0.85 (see Table 3).5 This also means that none of them is higher than the other.
Table 7. Posterior distribution for the parameters using a 2.3 standard deviation for priors of the parameters β and γ
Firms with high book-to-market ratio versus firms with low book-to-market ratio
We do not have enough data to be able to perform out-of-sample forecasting, however, we can assess the robustness of the model using different samples that have enough data. In this section we run the same regression as in equation (2) but for two subsamples.
We divide the firms between the 13 with higher book-to-market ratios and the 12 with lower book-to-market ratios in the spirit of Fama and French (2015).
Our results are as follows. The posterior mean of the parameters for book-to-market and earnings-to-price are statistically similar between the two subsamples and the whole sample (considering the 95% confidence intervals), Tables 8 and 9. However, according to their mean, the impact is about 2.0% in the case of firms with high book-to-market ratios. In the case of the spread, their impact is also bigger for high book-to-market firms.
These robust results imply that with both high and low book-to-market the excess returns can be forecasted and the determinants of book-to-market, earnings-price and spread are significant regardless of the differences in the characteristics of the stocks.6
Table 8. Posterior distribution for the parameters for the firms with lower book-to-market ratio

Table 9. Posterior distribution for the parameters for the firms with higher book-to-market ratio

Normal distribution and test for nonnegative expected returns
One concern in the literature on asset returns is to address its nonnegative result concerning book-to-market and earnings-to-price ratios. One way to tackle this issue in our analysis, and to check if the results remain robust to the selection of priors, is to re-run our regressions with a normal prior distribution for the parameters β and y. We use a normal distribution with a mean of 2 and a standard deviation of 2.3 and compute the probability that the parameters are between 0 and 2.5 for fi and between 0 and 3.3 for y. The results are presented in Tables 10 and 11. They show that the posterior mean of the parameter β 1.407 with a standard deviation of 0.599 and an equal-tailed 95 % credible interval between 0.194 and 2.569. The results for the parameter y are a posterior mean of 1.412 with a standard deviation of 0.958 and an equal-tailed 95% credible interval between -0.506 and 3.277. Regarding the nonnegativity of the results, the mean of the probability that fi is between 0 and 2.5 is 0.956 with a standard deviation of 0.205 and Monte Carlo standard errors of 0.004. The probability that y is between 0 and 3.3 is 0.903 with a standard deviation of 0.295 and a Monte Carlo standard error of 0.004. These results support the ones of the baseline model where the incidence of the book-to-market and the earnings-to-price ratios is similar and close to 1.5 %.7
Table 10. Posterior distribution for the parameters for book-to-market and earnings-to-price assuming a normal prior distribution with mean 2 and standard deviation of 2.38
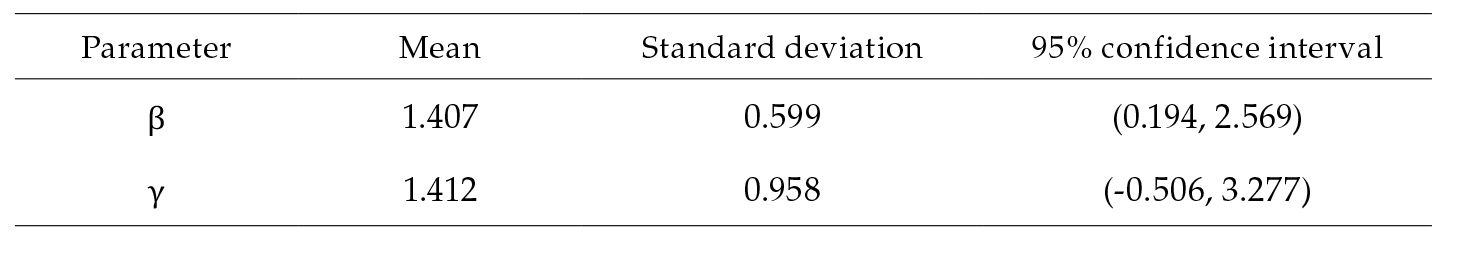
Table 11. Probability that the parameters for book-to-market and earnings-to-price are between 0 and 2.5 and between 0 and 3.3, respectively, when a normal prior distribution with mean 2 and standard deviation of 2.3 is assumed

Concluding remarks
Using Bayesian techniques, we find that for the stock market of an emerging market economy like Colombia, the ratios of book-to-market and earnings-to-price have predictability power during the period 2015-2022. One standard deviation in the ratios of book-to-market and earnings-to-price increases expected excess asset returns by about 1.5%. This finding is in line with some for the United States that none of them outperforms the other. The spread is another economic factor explaining excess asset returns; an increase of one p.p. in the spread translates into a decrease of about 1.9 p.p. in the excess returns. The latter is consistent with the UIP theory that predicts that when there is a positive spread, there are expectations of devaluation of the exchange rate and therefore the predicted excess asset returns fall. These results are also in line with some studies for emerging economies.
The results are robust in terms of estimations based on two subsamples of firms, one with higher and another with lower book-to-market ratios. But even though, both, the earnings-to-price ratio and the book-to-market ratio have a similar impact on one another, their impact is about 2.0 % in the case of firms with high book-to-market ratios.
The results are also robust to an increase in the standard deviation of the prior distributions of the parameters of book-to-market and earnings-to-price and to the assumption of normal prior distributions of these parameters.
Notas
1 In this way, the slopes of the regression can be interpreted as the incidence of a one standard deviation change in book-to-market and earnings-to-price. This makes easier the formulation of prior beliefs and the interpretation of the economic significance of the parameters.
2 The trace of a parameter plots the simulated values versus the iteration number. The trace plot of a well-mixing parameter should traverse the posterior domain rapidly and should have a nearly constant mean and variance.
3 A PPP (or a Bayesian p-value or a Bayesian predictive p-value) is then defined as the probability that a test quantity for the replicated data could be as or more extreme than for the observed data. You can think of a PPP as a classical p-value averaged over the posterior distribution (Meng (1994)). For a well-fitting model, the PPP should, ideally, be close to 0.5, although values between 0.05 and 0.95 are often considered acceptable in the literature (Gelman et al., 2014, p. 150; Congdon, 2010, sec. 2.5.2).
4 Consider simulated outcome values  for an observation it = 1, 2, …, n, where
  Let
Let  where
where 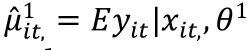 is the estimated expected value of yit given covariate vector Xit and simulated parameters
  Let
Let  be simulated residuals for an observation it. Simulated residuals are then defined as
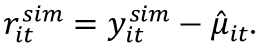
5 The diagnostic graphs for the estimation are provided under request.
6 The diagnostics statistics and model predictive performance in the sample are available upon request.
7 The acceptance rates and other models' diagnostics are provided upon request.
8 The estimations are made separately for earnings-to-price ratio and book-to-market ratio including in each the spread.
References
Ang, A., & Bekaert, G. (2007). Return predictability: is it there? Review of Financial Studies, 20(3), 651-707. https://doi.org/10.1093/rfs/hhl021
Campbell, J. Y., & Shiller, R. J. (1988). Stock prices, earnings, and expected dividends. Journal of Finance, 43(3), 661-676. https://doi.org/10.1111/j.1540-6261.1988.tb04598.x
Congdon, P. D. (2010). Applied Bayesian Hierarchical Methods. CRC Press.
Cooper, I., & Priestly, R. (2009). Time-varying risk premiums and the output gap. Review of Financial Studies, 22(7), 2801-2833. https://doi.org/10.1093/rfs/hhn087
Cowles, A. (1933). Can stock market forecasters forecast? Econometrica, 1(3), 309-324. https://doi.org/10.2307/1907042
Della Corte, P., Sarno, L., & Valente, G. (2010). A century of equity premium predictability and the consumption-wealth ratio: An international perspective. Journal of Empirical Finance, 17(3), 313-331. https://doi.org/10.1016/j.jempfin.2009.10.003
Fama, E. F., & French, K. R. (1988). Dividend yields and expected stock returns. Journal of Financial Economics, 22(1), 3-25. https://doi.org/10.1016/0304-405X(88)90020-7
Fama, E. F., & French, K. R., (1993). Common risk factors in the returns of stocks and bonds. Journal of Financial Economics, 33(1), 3-56. https://doi.org/10.1016/0304-405X(93)90023-5
Fama, E. F., & French, K. R. (2015). A five-factor asset pricing model. Journal of Financial Economics, 116(1), 1-22. https://doi.org/10.1016/j. jfineco.2014.10.010
Fama, E. F., & Schwert, G. W. (1977). Asset returns and inflation. Journal of Financial Economics, 5(2), 115-146. https://doi.org/10.1016/0304-405X(77)90014-9
Feng, G., Giglio, S., & Xiu, D. (2019). Taming the factor zoo: a test of new factors. nber Working Paper, 25481. http://www.nber.org/papers/w25481
Foye, J. (2018). A comprehensive test of the Fama-French five factor model in emerging markets. Emerging Markets Review, 37, 199-222. https://doi.org/10.1016/j.ememar.2018.09.002
Gelman, A., Carlin, J. B., Stern, H. S., Dunson, D. B., Vehtari, A., & Rubin, D.B. (2014). Bayesian Data Analysis. Chapman & Hall/cRC.
Gelman, A., Gilks, W. R., & Roberts, G. O. (1997). Weak convergence and optimal scaling of random walk metropolis algorithms. Annals of Applied Probability, 7(1), 110-120. https://www.jstor.org/stable/2245134
Harvey, C. R. (1994). Portfolio enhancement using emerging markets and conditional information. In S. Claessens, & S. Gooptu (Eds.), Portfolio investment in developing countries (pp. 110-144). The World Bank.
Henkel, S. J., Martin, J. S., & Nadari, F. (2011). Time-varying short horizon predictability. Journal of Financial Economics, 99(3), 560-580. https://doi.org/10.1016/j.jfineco.2010.09.008
Kellard, N. M., Nankervis, J.C., & Papadimitriou, F. I. (2010). Predicting the equity premium with dividend ratios: Reconciling the evidence. Journal of Empirical Finance, 17(4), 539-551. https://doi.org/10.1016/j.jempfin.2010.04.002
Kothari, S. P., & Shanken, J. (1997). Book-to-market, dividend yield, and expected market returns: a time series analysis. Journal of Financial Economics, 44(2), 169-203. https://doi.org/10.1016/S0304-405X(97)00002-0
Meng, X. L. (1994). Multiple-imputation inferences with uncongenial sources of input (with discussion). Statistical Science, 9(4), 538-573. https://doi.org/10.1214/ss/1177010269
Pontiff, J., & Schall, L. D. (1998). Book-to-market ratios as predictors of market returns. Journal of Financial Economics, 49(2), 141-160. https://doi.org/10.1016/S0304-405X(98)00020-8
![]()