Introduction
The labor market is subject to shocks of different natures and signs and is influenced by economic, social, and demographic dynamics. This often leads to the various traditional employment-related indicators moving in contradictory directions and offering divergent signals.
It is complex to have a single and structured reading of labor market conditions in the short term, considering the diverse information and trends offered, for example, by the unemployment rate, the employment rate, the overall participation rate, the number of people employed in different industries, wages, and other indicators by gender, age, or productive sectors. The employment and unemployment rates are expected to almost always move in opposite directions. Still, this rule is violated frequently, making it difficult to interpret the underlying trends of the labor market and the economic cycle, the analysis of the effect of public policies, and private sector decisions.
Efforts to build synthetic indicators of the labor market at the regional or city level within countries are not frequent. An indicator summarizing the aggregated evolution (incorporating economic, social, inequality, and expectation variables) allows for a standardized and comprehensive comparison between regional labor markets.
After the pandemic, cities within Colombia quickly resumed a gradual recovery of the leading labor market indicators. However, the recovery, like the fall during the border closure and physical distancing measures, was heterogeneous. Different authors have studied evidence showing more significant vulnerabilities in certain social groups and economic sectors during the pandemic, for example, among young people, women, workers in the trade, hospitality, and tourism sector, in informal employment, and micro and small enterprises (Adams-Prassl et al., 2021; Alon et al., 2021; Bonilla & Gaviria, 2020; Cajner et al., 2021).
Velasco (2021) analyzes that, in Latin America during the pandemic, the reduction in labor participation was much more pronounced among women, and the destruction of informal jobs was more significant than the contraction of formal employment, unlike previous crises. The author also examines how informal employment absorbed part of the loss of salaried and formal jobs. In Colombia, Morales et al. (2022) found that salaried workers were the most affected by these mobility restrictions, especially in activities where teleworking was impossible. They also conclude that industries with many small companies and a high proportion of minimum wage employees were more affected during the pandemic.
Such heterogeneities are not new, although some seemed to widen during the pandemic and subsequent economic recovery. At the city level, labor market divergences have been visible, responding to particularities in the productive structure and employment and the policies applied by local authorities.
The heterogeneous evolution of the regional labor market can be broadly appreciated in traditional indicators such as the unemployment rate, participation in the labor force, and employment, among others reported by statistical offices. However, interregional comparisons can lead to different conclusions depending on the indicator considered, as not all show the same trends or gaps when comparing cities.
This article proposes a methodology combining different variables of the regional labor market to develop a monthly indicator that synthesizes the aggregated or average situation, considering traditional employment metrics and variables that consider social and inequality aspects. The indicator captures the evolution of the employment and unemployment rates and contains information on gender, age, informality, productive sectors, and expectations. In this way, a more comprehensive understanding of the labor market situation can be achieved, better highlighting regional differences and analyzing the heterogeneous impact of the pandemic and subsequent recovery.
Regarding the methodology, the indicator has two notable aspects. First, Google searches related to the labor market are used, which allows for considering public perceptions and expectations regarding employment and incorporating the indicator within the emerging data analysis trend by using information from social networks and the Internet. Second, Machine Learning (ML) methods are utilized; in particular, Lasso regression and "Backward Stepwise" are used to select the most relevant variables in the indicator estimation. Machine Learning techniques and the Dynamic Factor Model are applied to extract the comovement among the selected variables using Principal Components.
The methodology is exemplified in the Colombian cities of Cali, Medellín, Bogotá D.C., and Popayán. To date, the authors are not aware of any similar exercises developed to assess the labor market at the city level using these methodologies. At a country level, Orozco-Castañeda et al. (2024) developed a labor market indicator using a methodology similar to previous models. However, they focused on forecasting labor market outcomes through machine learning techniques. By incorporating diverse data sources, including Google search data, their approach aimed to enhance the accuracy of Colombia's employment and unemployment rate predictions, providing more precise labor market assessments during the unprecedented times of Covid-19. Furthermore, Vidal et al. (2017) have utilized the factor model to estimate the Monthly Economic Activity Indicator (IMAE), which has been applied across various regions, including Valle del Cauca, Cauca, Antioquia, Cali, Caribe, and Nororiente. For applications of the IMAE in Colombia, refer to Sierra-Suarez et al. (2022) and Orozco-Gallo et al. (2021). For a more detailed explanation of the methodology used to create economic activity indexes using factor models, see Sierra-Suárez et al. (2017).
The selection of Cali, Medellín, Bogotá D.C., and Popayán for this study is strategic, as economic activity indicators (IMAES) are already established for these departments. This existing data enables seamless integration and enhances complementarity with ongoing studies examining the relationship between labor indicators and economic activity at a regional level. In addition to the research and analysis phase, the construction of the indicators has the potential to be updated monthly as a tool for systematically monitoring the labor market and analyzing the economic situation in the cities.
The rest of this document is organized as follows: Section 2 presents a brief review of the literature on the importance of new sources and data management techniques for the labor market; Section 3 describes the evolution of the labor market in the cities under analysis; sections 4 and 5 describe the methodology and the data, respectively; Section 6 presents the results; and Section 7 contains the conclusions.
Literature Review: New Information Sources for the Labor Market and Machine Learning Techniques
Various measures can explain the labor market's performance, including the unemployment rate, the employment rate, the labor force participation rate, different metrics on labor underutilization, long-term unemployment, unemployment flows by social groups, the average weekly hours worked, and wage growth (Zmitrowicz & Khan, 2014).
The unemployment rate is usually considered the metric that best describes the labor market conditions (Dvorkin, 2015; Zmitrowicz & Khan, 2014). However, it is recognized that the unemployment rate is just one aspect of the labor market. Many other characteristics of labor market conditions are no less important. A more extensive list of crucial indicators for the labor market can be found, for example, in the works of Ramos-Veloza et al. (2019) and Hakkio and Willis (2013). The challenge when moving towards a more inclusive information approach is the complexity of combining and simultaneously interpreting the disparate indicators that approximate the labor market conditions from different angles, scales, and frequencies.
The reports from the National Administrative Department of Statistics (DANE) of Colombia generally highlight three indicators as the core of labor market analysis, measured from the Great Integrated Household Survey (GEIH): the unemployment rate (proportion of the labor force that is currently not occupied), the labor participation rate (percentage of the working-age population that is employed or actively seeking employment), and the employment rate (number of people employed compared to the total working-age population). All these are standardized metrics used internationally. However, DANE systematically calculates and publishes a broader range of labor market indicators that analysts, media, and the public increasingly consider.
The construction of indicators synthesizing the characteristics and trends of an economy, a market, or an industry is not new. Different methods have been refined and explored for these purposes. One of the most used methods to build indices or latent factors is the Dynamic Factor Model (DFM), which can be estimated using principal components or the Kalman filter (Chung et al., 2015; Sierra-Suárez et al., 2017; Swanson & Xiong, 2018; Vidal et al., 2017).
The construction of synthetic indicators has benefited from the expansion of Web 2.0, which represented a significant change in how the Internet is used, moving from a platform of passive consumption to one of user participation. In this new paradigm, users create and share content, interact, and collaborate through dynamic web platforms and applications. This has resulted in an explosion of user-generated data, which are collected, analyzed, and used for various purposes. This phenomenon has led to the era of "Big Data." New information sources sometimes provide data volumes that are too complex for traditional processing methods. Big Data is essential for many modern applications, such as Machine Learning (ML), predictive analytics, marketing personalization, and data-driven decision-making.
Due to data capture, storage, and computational power advances in the last decade, ML tools have become crucial for managing large data sets (Baldacci et al., 2016; Medeiros et al., 2019). One of the virtues of ML methods is that, when working with large data sets and potential variables, they allow for the reduction of the database's dimension following specific statistical selection criteria. Other important properties are their effectiveness in modeling complex relationships and their application across multiple fields (Varian, 2014).
In recent years, ML techniques such as "Backward Stepwise" selection and Lasso regression ("Least Absolute Shrinkage and Selection Operator") have become popular for selecting a relevant subset of explanatory variables and reducing the complexity of the model. Choi and Shin (2019) demonstrated that data differentiation and dimensionality reduction with the Lasso method improved prediction accuracy and computational efficiency. Similar results have been valued with the "Backward Stepwise" technique.
Within macroeconomic forecasting, selection methods are widely used to decrease the number of predictors utilized. Chen and Wu (2023) adopted an innovative approach by combining the Lasso method with the ARIMA model to forecast Chongqing's GDP. They showed that Lasso selected key economic features and indicators linked to Chongqing's GDP, thereby improving the accuracy of short-term forecasts. Jokubaitis et al. (2021) integrated the Lasso technique with principal components to enhance the prediction of GDP components in the United States and the European Union. Their research showed that the Lasso selection method outperformed conventional approaches based on principal components, significantly identifying more effective predictor sets.
In their study, Qin et al. (2022) created an algorithm based on supervised dimensionality reduction for macroeconomic predictions. Their conclusion highlighted that the "Backward Stepwise" selection method allowed for choosing the optimal set of financial indicators, one-dimensional, partial, and leading variables of macroeconomic variables, from an initially broad set. This subset proved most effective for short-term macroeconomic forecasts in the United States.
The computational methodology of ML is increasingly applied in economics and finance, prediction exercises, and indicator construction. New approaches seek to compete with traditional models and offer better outcomes. Various authors conclude that ML techniques perform better when there is a larger data set than traditional estimation methods (Baldacci et al., 2016; Mullainathan & Spiess, 2017; Swanson & Xiong, 2018; Varian, 2014).
Another trend in data analysis incorporated in the labor market indicator in this article is information from Google Trends. One of the first studies to test the validity of using Google Trends data to predict the labor market was by Choi and Varian (2012). Caperna et al. (2020) studied the impact of the Covid-19 pandemic in 27 European Union countries using Google Trends data to predict the unemployment rate. Simionescu and Raisiené (2021) used Google Trends data to measure the impact of the pandemic on employment expectations. Jun et al. (2018) examined the growing utility of Google Trends searches in research across numerous areas such as informatics, communications, medicine, health, business, and economics. Their ten-year review of research using Google Trends finds that the approach has moved from merely describing trends to using these data to build projections.
In Colombia, the work of Cardona and Rojas (2017) must be mentioned, which proposed using Google Trends data to improve short-term predictions of national unemployment rates. The authors selected Google search terms that were most related to unemployment rates and estimated simple linear regression models, ARIMA models, and ARIMA models with exogenous variables. The study found that search volume improved model fitness and that searches for terms like "Job," "Job offers," and "Looking for a job" improved predictions of labor market behavior. The analysis concluded that Google Trends data can be a valuable tool for predicting unemployment rates in Colombia.
In Latin America, the work of Campos and López-Araiza (2020) stands out, as they explored the use of Google Trends data and Machine Learning algorithms to predict the unemployment rate in Mexico. The results showed that the Lasso method outperformed an autoregressive model, even when incorporating Google data, and that the random forests method performed slightly worse than Lasso. The article highlighted the importance of these methods and new data sources for economic research and policy design.
The Colombian Regional Labor Market According to the Unemployment and Employment Rate
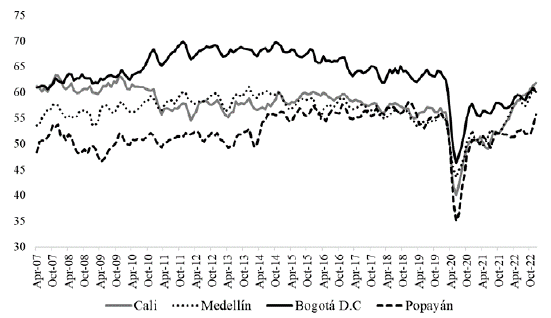
Figures 1 and 2 show, for the four analyzed Colombian cities, the monthly frequency trajectory of the two main metrics usually employed in the labor market: employment rate and unemployment rate. These data represent the comparison point against which the signals provided by the labor market indicator estimated with ML and MFD techniques are later contrasted.
In the employment rate series, greater heterogeneity among the cities can be observed until 2014, and a greater convergence between Medellín, Cali, and Popayán since 2015. During the Covid-19 pandemic, the employment rate for the four cities recorded the most significant drop, particularly during the second quarter of 2020, when the most restrictive measures for border closures and mobility control took place. According to this metric, Popayán was the city that registered the lowest employment rate during this period, falling to 35.1 %, the lowest in its history. It was followed by Cali (40.1%), Medellín (43.6%), and Bogotá (46.3%). From the third quarter of 2020, a gradual recovery in the regional employment rate is evident (Figure 1).
In 2021 and 2022, the recovery of the employment rate in the four cities is observed, although with different levels and speeds, once again highlighting significant regional heterogeneities. By the end of 2022, Cali, Medellín, and Bogotá stand out for resuming employment rates over 60 %. In contrast, Popayán closed 2022 with a lower employment rate (55.8%).
Figure 1
Evolution of the Regional Employment Rate (Monthly Data, 2007-2022)
Source: Authors' elaboration.
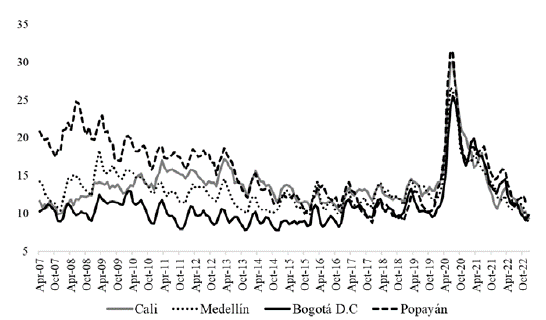
Figure 2
Evolution of the Regional Unemployment Rate (Monthly Data, 2007-2022)
Source: Authors' elaboration.
There are several coinciding signals in the recent historical evolution of these two essential metrics of the Colombian labor market. The regional unemployment rate (Figure 2) also shows greater heterogeneity among the cities until 2014 and greater convergence from 2015. On average, Bogotá has a more robust labor market (a significantly higher employment rate than the other cities examined and a lower unemployment rate), with Popayán at the other extreme. The impact of the pandemic during the same period in the four cities and the subsequent recovery is also visible.
However, there are also some notable differences between these two metrics. For example, the convergence between labor markets since 2015 is much greater when examining the unemployment rate than the employment rate. Before the impact of the pandemic (2019), Cali had the highest unemployment rate, while Medellín had the lowest employment rate. The signals between these metrics during the pandemic and subsequent recovery are also contradictory. While they agree that Bogotá was the city least impacted by the pandemic and Popayán the most affected, according to the unemployment rate, Medellín was the second city affected. In contrast, according to the employment rate, Cali was the second most affected city. In 2021 and 2022, the unemployment rate indicates a much more synchronized recovery than the information offered by the employment rate.
Another event that affected the Colombian labor market in this period was the social protests and road blockades in May and June of 2021. Both the unemployment and employment rates show that Popayán and Cali were the most affected cities, but they disagree on the least affected cities. The unemployment rate suggests that Medellín had the most negligible impact, while the employment rate indicates that it was Bogotá.
Methodology
The regional labor market indicator was created using a two-step methodology: first, variables from the registry built for each city (see Annex A) were selected using ML techniques. Specifically, the "Backward Stepwise" selection and Lasso Regression methods were used. The goal is to identify an optimal subset of variables that later facilitates and improves the estimation process (James et al., 2013). Variables in which both methods coincided were selected.
After selecting the optimal and most relevant number of variables through the two ML methods, the regional labor market indicators were constructed based on the Dynamic Factor Model (MFD).
Backward Stepwise Selection
Backward Stepwise Selection starts with a complete set of potentially predictive variables and iteratively removes the least important ones from a regression model one at a time. The process is based on minimizing the regression model's cost function and selecting the least important variables according to some predefined criterion, which can be the p-value or the adjusted coefficient of determination, also called adjusted R-squared (R2) (Guyon and Elisseeff, 2003; Hastie et al., 2009; James et al., 2013; Miller, 2002). The cost function is defined in equation 1 as:
where,
n is the number of observations
y ¡ is the observed value of the response variable
 ¡
is the value predicted by the regression model
¡
is the value predicted by the regression model
Lasso Regression
Lasso Regression is a regression and variable selection technique used to estimate linear models while simultaneously performing automatic variable selection by reducing some coefficients to zero. The method aims to minimize the cost function, which includes a penalty on the sum of the absolute values of the coefficients. This leads to automatic variable selection, as some coefficients are reduced to zero. The penalty value controls the degree of constraint on the magnitude of the coefficients (Tibshirani, 1996).
The goal is to minimize the cost function, which involves finding the optimal values for the coefficients ß j and the optimal value of λ. As the value of À increases, more coefficients will be reduced to zero, leading to automatic variable selection by identifying those most important for prediction (Hastie, et al., 2009; Tibshirani, 1996).
The cost function is summarized in Equation 2 as:
where,
n is the number of observations
p is the number of predictor variables
yi is the observed value of the response variable
¡
is the value predicted by the linear model
ß j is the regression coefficient associated with the predictor variable.
λ is the regularization or penalty parameter
Dynamic Factor Model
The Dynamic Factor Model (DFM) assumes that a matrix Y t of N observed variables can be represented as the sum of two unobservable components that are mutually independent: a common component to all variables F t , and an idiosyncratic component μt which represents the unique dynamics of each series (Sierra-Suárez et al., 2017).
Thus, the equation for the observed series, Y t can be represented in vector form as:
where,
Y t is a vector with t
he observed labor market variables
P is the factor loading matrix (weights)
F t is the common factor (labor market indicator)
μt which represents the unique dynamics of each series.
The Principal Components (PC) method was used to estimate the common factor (Jolliffe, 2002; Jolliffe & Cadima, 2016; Sierra-Suárez et al., 2017). PC has a long history of estimating economic activity indicators (Chung et al., 2015; Hakkio & Willis, 2013; Stock & Watson, 2012).
Data
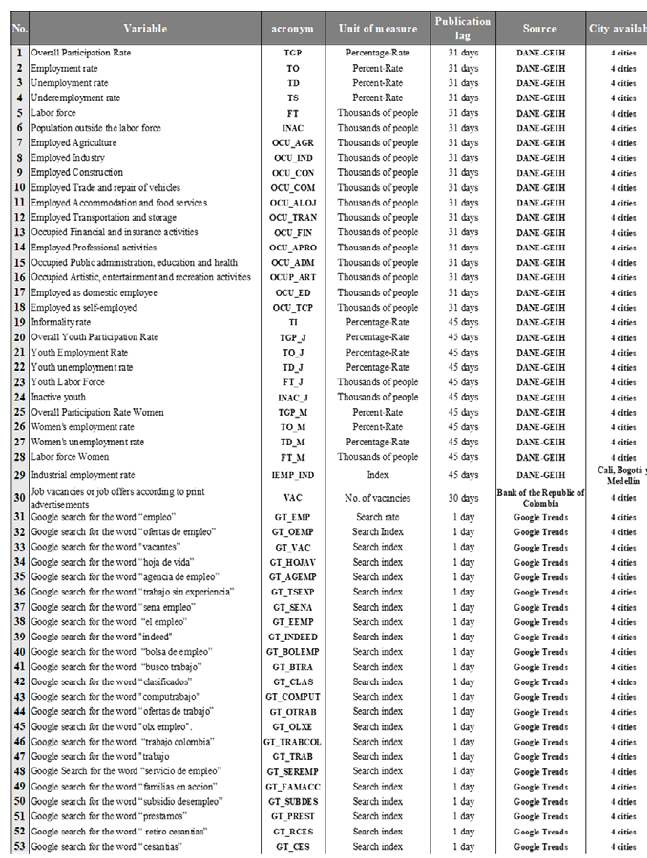
The starting point for the labor market indicator was the construction of a database as broad as possible, with variables related directly and indirectly to the labor market in each of the four study cities, which were available on a monthly frequency. For Cali, Medellín, and Bogotá, 53 variables were collected, and for Popayán, 51 variables for 2007-2022. The primary source of the data was DANE, through the GEIH, which collects monthly information on employment, the workforce, and the sociodemographic characteristics of the Colombian population (Annex A).
Information on the main search terms related to the dynamics of the labor market in each city of analysis was extracted from the Google Trends platform. This platform reports the search indices for any word in the browser. This information is available in real-time for different frequencies, although this article uses its monthly version. With unrestricted public access, the data are available at the national, departmental, and large city levels.
Google Trends reports an index ranging from 0 to 100 over the selected period. "The numbers reflect search interest relative to the highest value in a region and over time. A value of 100 indicates the maximum popularity of a term, while 50 and 0 indicate popularity that is half or less than 1%, respectively, to the highest value" (Google, 2022).
Table 1 presents the search terms considered. The 23 queries included were associated with the job search process, platforms, tools, or online entities dedicated to job search and/or personnel recruitment, and government aid for unemployment (subsidies). Additionally, the previous study conducted in Colombia by Cardona and Rojas (2017) and the search suggestions highlighted by the Google Trends platform with greater relative importance recorded during the last years were considered.
Table 1
Search Terms in Google Trends for Cali, Medellín, Bogotá D.C., and Popayán
Variables Selected with ML Techniques
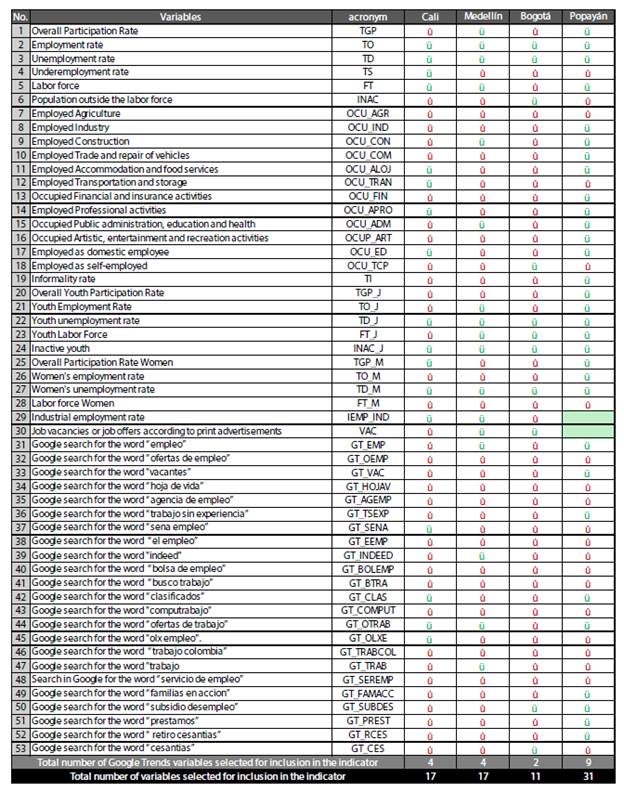
Using the ML techniques of Backward Stepwise and Lasso, 17 variables were selected for Cali and Medellín, 13 from DANE or the Bank of the Republic, and 4 variables related to search terms in Google Trends. For Bogotá, 11 variables were selected, 2 from Google Trends. In Popayán, the two methods selected 31 variables, 22 from DANE or the Bank of the Republic and 9 from Google Trends. Variables were selected with agreement in both methods (see Annex B).
The first interesting result is that the ML techniques confirm the importance of including some of the Google Trends searches in the database for the labor market indicator in combination with traditional employment metrics and variables of gender, age, specific productive sectors, and informality.
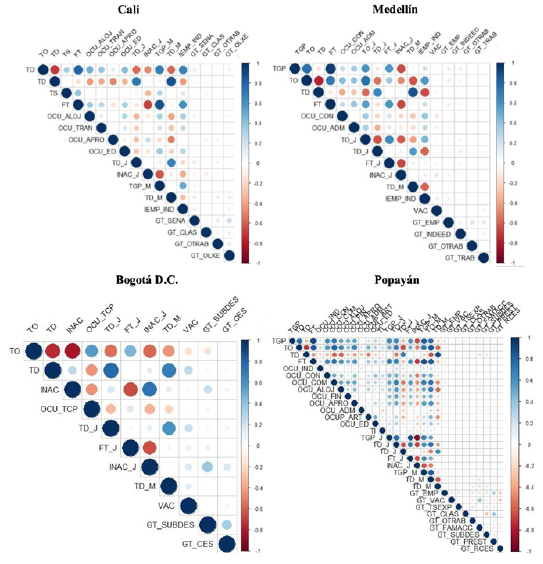
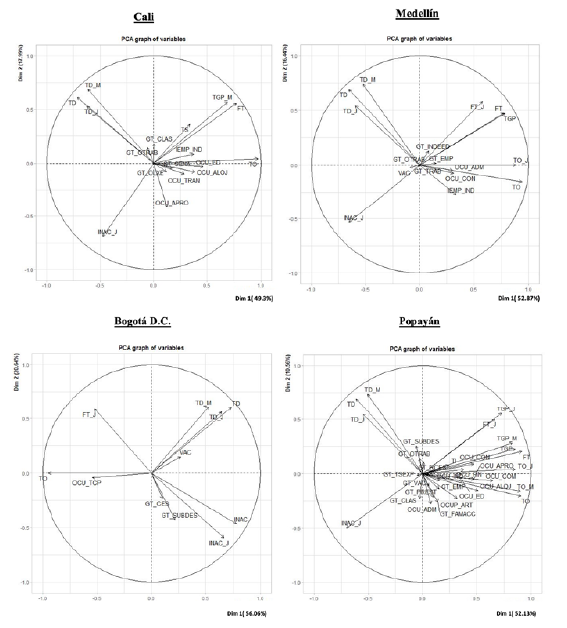
Figure 3 shows the graphical correlation between the selected variables, which provides initial information on the comovement that is later estimated with the DFM. In Cali, a strong positive correlation was evidenced between the employment rate and the workforce, employment in the industrial sector, and female participation. Conversely, a strong negative correlation was found between the employment rate and the total unemployment rate, youth unemployment, and female unemployment. Regarding the unemployment rate, there was a positive relationship between the total, youth, and female unemployment rates. It also highlighted that the four search terms from Google Trends positively correlated with employment and unemployment rates.
In Medellín, the behavior was similar, although it was noted that one of the search terms, in this case, "empleo" (employment), showed a negative correlation with the city's total unemployment rate and that the correlation between the four search terms was positive. In Bogotá, the two selected search terms "subsidio desempleo" (unemployment subsidy) and "retiro de cesantías" (withdrawal of severance pay) showed a negative correlation with the employment rate. A positive correlation was evidenced between them.
In Popayán, on the other hand, a significant positive correlation was evidenced between the employment rate, the workforce, female labor participation, and employment, and the personnel employed in the trade, accommodation, and food sectors. Regarding the unemployment rate, the highest positive correlations were recorded with the youth and female unemployment rates. Of the terms searched on Google, the positive correlation between the term "subsidio desempleo" (unemployment subsidies) and the unemployment rate stood out, and the negative correlation between the search term "clasificados" (classifieds) and "subsidio desempleo" (unemployment subsidy).
Results
Using the DFM (equation 3), a common factor (F) or comovement among the variables selected with ML techniques for the labor market of the four cities was estimated using the Principal Components (PC) method. Figure 4 shows two principal components and demonstrates that the first principal component explained the largest proportion of the total variance for the four regions analyzed. In Cali, the first component accounted for 49.3 % of the total variance, while the second accounted for 17.9%. In Medellín, 52.8% and 16.4 %; in Bogotá D.C., 56 °% and 20.6 %; and in Popayán, 52.3% and 10.5%, respectively. The labor market indicator was constructed based on the information captured by the first principal component in each city.
Figure 4
Representation of Variables in the First Two Components (Dim 1 and Dim 2) of the Labor Market Indicator in Cali, Medellín, Bogotá D.C., and Popayán
Source: Authors' elaboration.
Tables 2-5 present the weights (P) estimated by the PC method within the DFM (equation 3). These are converted into percentage terms representing each variable's contribution to each city's labor market indicator.
For the city of Cali, 6 out of 17 variables contribute about 76 % to the labor market indicator (dim1): employment rate (22.21 %), labor force (13.8%), unemployment rate (11.85%), overall participation rate of women (11.12 %), youth unemployment rate (9.1 %), and women's unemployment rate (8.8 %), as part of the labor market indicator in Cali. The four Google Trends variables contribute about 1.1 %.
In Medellín, 6 out of 17 variables contribute 74 % to the labor market indicator: employment rate (17.6 %), youth employment rate (15.6%), overall participation rate (12.2 %), labor force (11.9 %), unemployment rate (8.5 %), and inactive youth (8.4%). Notably, the 4 Google Trends variables contribute 0.6 % to the indicator (Table 3).
In Bogotá, 5 out of 11 variables contribute about 75 % to the indicator: employment rate (23.1%), population outside the labor force (15.6 %), unemployment rate (13.8 %), inactive youth (11.4 %), and youth unemployment rate (10.7 %). The two selected Google Trends variables contribute 1.44 % to the indicator.
In Popayán, the largest contributions to the indicator are observed in the employment rate (9.49 %), the labor force (9.63 %), overall participation rate (8.3 %), women's employment rate (9.41 %), and youth employment rate (8.45%). The selected Google Trends variables contribute 0.7% to the indicator.
Table 2
Contribution of Variables to the Labor Market Indicator of Cali
Table 3
Contribution of Variables to the Labor Market Indicator of Medellín
Table 4
Contribution of Variables to the Labor Market Indicator of Bogotá D.C.
Table 5
Contribution of Variables to the Labor Market Indicator of Popayán
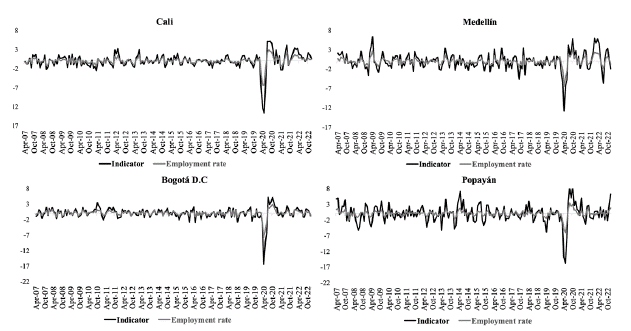
Figure 5.A compares the trajectory of the common factor estimated for the labor market of each city and the employment rate (standardized monthly variations). It is evident that the time series of the employment rate adjusted to the first principal component. A match in the sign of most of the monthly variations was observed, as well as similarity in the periods of greatest expansion and contraction, including the time of the pandemic. However, as expected, the trajectories are not identical because the indicator contains additional information on the labor market that goes beyond employment.
Similarly, Figure 5.B presents the relationship between the estimated labor market indicator and the regional unemployment rate. The patterns observed reinforce the indicator's robustness, showing an inverse relationship with the unemployment rate, as expected. This inverse correlation is particularly pronounced during the pandemic, when a sharp decline in the labor market indicator coincides with a significant peak in unemployment in the cities analyzed.
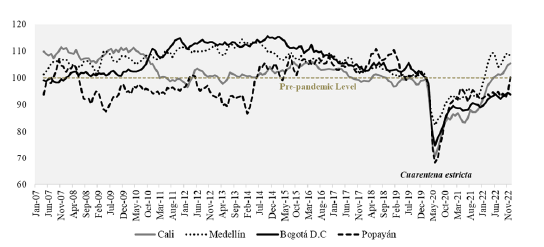
To provide a clearer and more interpretable trend, Figure 6 presents the indicator (estimated common factor) smoothed with the Hodrick-Prescott filter, rescaled and transformed into an index with February 2020 = 100 (pre-pandemic level). An increase (decrease) in the indicator suggests an improvement (worsening) of the regional labor market, integrating traditional employment metrics and social and equity variables, expectations, and specific productive sectors into this signal.
The indicator also shows greater heterogeneity among regional labor markets until 2014 and a convergence process from 2015. The impact of the pandemic on the labor market is visible in all four cities. Popayán was the city that registered the greatest deterioration compared to the pre-pandemic level: the indicator was 32 % below the levels recorded in February 2020. Cali is the second most affected city, with an indicator 29.2 % below the pre-pandemic level. In Bogotá and Medellín, the indicator remained 25.2 % and 17.6% below the February 2020 levels, respectively.
Since the last months of 2020, the labor market indicator reports a recovery trend that was briefly interrupted by the national strike and social protests during May and June 2021 in the cases of Cali and Popayán. In 2022, the indicator reports the continuation of the recovery. Medellín is the first city to surpass pre-pandemic levels in February 2022. Cali's labor market, for its part, surpassed pre-pandemic levels in June 2022, and Popayán achieved it in December 2022. In contrast, the labor market in Bogotá D.C. still in December 2022 remained 6.2% below pre-pandemic conditions.
Table 6 summarizes the differences in the signals that could be obtained when comparing regional labor markets using only the information from the unemployment rate and the employment rate (see section 3) and using the labor market indicator. The similarities and differences appear when comparing traditional employment metrics with an indicator that allows for a more comprehensive understanding of the labor market situation.
For the practical application and monthly update of the estimated labor market indicator, a publication delay of approximately 45 to 50 days is expected, considering the availability of its component variables (see Annex A).
Figure 5.A
Labor Market Indicator and Regional Employment Rate-(Standardized Monthly Variation)
Source: Authors’ elaboration.
Figure 5.B
Labor Market Indicator and Regional Umemployment Rate-(Standardized Monthly Variation)

Source: Authors’ elaboration.
Figure 6
Trajectory of the Regional Labor Market Indicator (2007-2022) (Index February 2020=100, Pre-pandemic Level)
Source: Authors’ elaboration.
Table 6
Summary of Compared Signals on the Labor Market
Conclusions
This article proposes a methodology to estimate an indicator that summarizes the aggregated evolution of the labor market by combining economic, social, inequality, and expectation variables. This allows for a standardized and more consistent comparison among regional labor markets. The methodology is applied in four Colombian cities (Cali, Medellín, Bogotá D.C., and Popayán). It covers the period of the Covid-19 pandemic impact and the subsequent evolution, a time when several authors have emphasized the increase in labor market heterogeneities.
The methodology employs Machine Learning techniques to select the most relevant variables for estimating the indicator. Once the comovement among them is estimated, the selected variables allow for a synthetic characterization of labor markets. For this purpose, a Dynamic Factor Model is used, which allows aggregating the variables based on appropriately estimated weights (contributions).
The Machine Learning techniques confirmed the importance of including Google Trends searches in the labor market indicator in combination with traditional employment metrics and variables of gender, age, specific productive sectors, and informality. Google searches related to the labor market allow considering public perceptions and expectations regarding employment and integration of the indicator within the emerging trend of data analysis using information from social networks and the Internet.
The impact of the pandemic on the labor market is visible in all four cities, as well as the heterogeneities during the recovery. The indicator's trajectory coincides with the signals reported by the employment rate and the unemployment rate but also presents differences because it contains additional information on gender, age, informality, productive sectors, and Google Trends data, allowing for a more comprehensive understanding of the labor market situation.